![]()
![]()
![]()
![]()
![]()
![]()
![]()
![]()
Back to Visual-tm home On to tutorials What is Visual-tm?
Our Visual-tm (Peter Davidson's Visual Transport Modeller) software is an integrated modelling workbench designed by transport planners for:
- Modelling major conurbation transport
- Interurban highways and railways
- Major/ minor highway scheme appraisal
- Heavy/ light rail, revenue, funding, appraisal
- Major Scheme Bid design and appraisal
- Transport strategy
- Local transport plans
- Setting and monitoring APR targets
For use by Government, Local Authorities, transport operators, consultants, research and funding agencies worldwide.
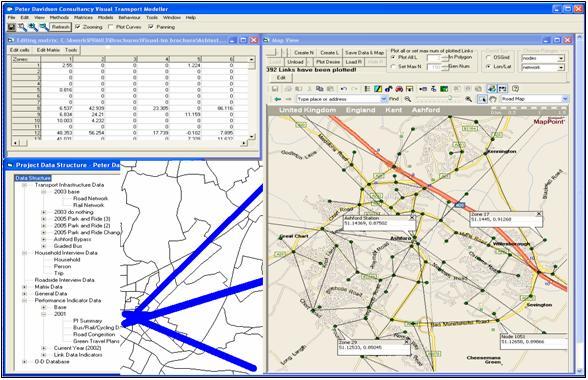
Why is Visual-tm so easy to use?
No problems presenting data to Visual-tm its all in simple spreadsheets.
You get top quality tools in a fully integrated Windows environment. Its intuitive simply point and click:
All controlled from simple screens with default parameters and options so easy to change:
Display results on a map, output directly to spreadsheets or graphs or straight to your GIS.
No waiting overnight for your results its fast, very fast.
How does it make my modellers more efficient?
- It is quicker to learn the software
- Quick to set up, get round, run your models
- Its not modular so theres no connecting up
- Just connect distribution, mode choice and assignment - your way - with complete control
- Distribution, mode choice, assignment are packed with functionality to save you time
- Automatic calibration, spreadsheet validation
- Completely checkable - its certainly not a black box
- It all connects with your back-end processes (eg spreadsheets, monitoring, GIS)
Design junctions directly in Arcady2/ Picady2/ Oscady2 and test your designs in your model.
What Sub-Models can I Build with?
All the models you need and more and they fit together properly:
Distribution: gravity model, incremental gravity model, furness, factoring; use logsums or generalised cost. Apply different model types and different coefficient sets to different parts of your matrix all in one distribution model run. Dovetails with mode choice.
Mode choice: matrix logit, skims, park and ride skims, coefficients, logsums. Apply different model types and different coefficient sets to different parts of your matrix all in one mode choice model run. Dovetails with distribution.
Assignment: Automatic iteration with assignment, delay, capacity restraint so you dont have to connect anything up its already done! Highways and PT connect up properly so highway speeds automatically carry through to bus. Generalised cost single or multi-paths. Assignment: normal or clocktime/ timetable; volume averaging, successive averaging, incremental loading. Outputs: link and line loadings, fare and revenue by company. Assignment can be run for:
- Highway with junction delay simulation and capacity restraint.
- Public transport with interchange delay micro-simulation and overcrowding capacity restraint.
Skims eleven variables simultaneously which dovetail with distribution and mode choice. Select link and turning movement analysis for both highways and pt. Capacity restraint uses link speed/flow equations.
How Can I fit My Models Together?
You can use already-built multi-mode four stage models or build your own:
Two Mode Four Stage: An already-built four stage model for rapid model development. Input highway and public transport networks, trip ends, economic parameters and iterate through distribution; mode choice; sub-iterate highway assignment through capacity restraint; output skims; repeat distribution -> assignment iterations until supply/ demand equilibrium. Output public and highway assignments etc. A complete 100-zone model forecast takes 2 minutes!
Multi Mode Four Stage: For bigger, more complex models, more modes or finer segmentation. Runs distribution, mode split, assignment sequence as above. A complete 300-zone incremental model forecast takes 20 minutes.
Build your own Model with Macros: macro record/ run from file editable in Excel. Screens, buttons and controls have a unique name. Macros can call macros, have substitutable parameters and relative pathnames which makes our macros really useful.
Program Your Own Model in your chosen language (Visual Basic, Delphi etc) with your filenames, parameter values, loops and condition statements to get your own model sequence and convergence.
Program Your Own Model Objects In C/C++: create, use, destroy our model objects or your own - all under your program control. Visual-tm is written this way.
Time of Day assignment
The day can be divided into consecutive time periods and assigned in sequence with the output from one time period, as the starting condition for the next, for both highway and public transport. Trips in transit at the end of one time period are carried over into the next, with each part put into its correct assignment. Time periods are divided into ten-minute time intervals and the clocktime/ timetable assignment keeps track of the clock time at each network node. Junction and interchange turning movement flows are accumulated for each time interval and passed to the junction and interchange microsimulators which pass back turning delays for the next assignment iteration.
More detail about time of day assignment
Highway junction delay
Takes the turning flows by vehicle type and time interval and calculates the queuing and delay, by taking the queue at the beginning of the time interval, adding the effect of the turning flows in that interval and calculating the queue at the end of the interval using time dependent queuing theory. Delay by turning movement and time interval can be weighted by its own generalised cost parameter for congestion charging. Working with TRL, we have connected in their junction design software so the junction capacity equations are from Arcady/ Picady/ Oscady with which you can browse or re-design your junctions ready for re-testing with Visual-tm.
More detail about highway junction delay
Public Transport Overcrowding and Delay
Overcrowding. You specify the type of vehicle, capacity etc of individual services and Visual-tms Interchange Microsimulation limits the passengers boarding at each stop to the vehicles capacity and calculates the alighting and boarding time. Any extra and it delays the vehicle downstream.
Interchange Microsimulation models the individual packets of passengers who alight at one platform/ bus stop and board another or enter/ leave the interchange on foot. Individual platforms, bus stops, entry/ exit walkways, interconnecting walk links, capacities and crowd equations are coded into an interchange network to which each passenger packet is assigned. Speeds are given by user-defined crowd/ speed equations. At the boarding platform/ bus stop the packet queues for the next train/bus and if it cant get on, it waits for the next one. Delays are passed back to assignment.
More detail about public transport overcrowding and delay
Parking and Park & Ride
Car drivers chose their car park depending on generalised cost paths on all possible routes to their destination by road and by public transport. To use public transport they have to park in a car park first and pay their parking charge. The car is assigned to the highway network and included in capacity restraint. From there the occupants are assigned to the public transport network. For kiss and ride, the return car trip is assigned to the highway. Cycle and ride uses cycle speeds. Car parks are capacity constrained.
Parking and park & ride dovetails with the other models so that short/ long stay, type of parking, cost relative to city centre parking cost, the availability of different types of parking to different types of people can be reflected in your model. Skims separate the car and public transport components of the attributes.
More detail about parking and park & ride
Accessibility Planning with Visual-tm
We know what you want Visual-tm can calculate your accessibility indicators, measure, model, forecast and monitor your accessibility:
- Use many of DfTs data sources
- ATCO CIF public transport network files
- Set your own weighting and thresholds
- Set your own targets
- Accessibility planning
- Answer your What ..if questions
- Connect to your transport model
- Forecast accessibility at the end of your LTP
- Monitor to make sure you hit your targets
2310 census output areas takes 10 minutes!
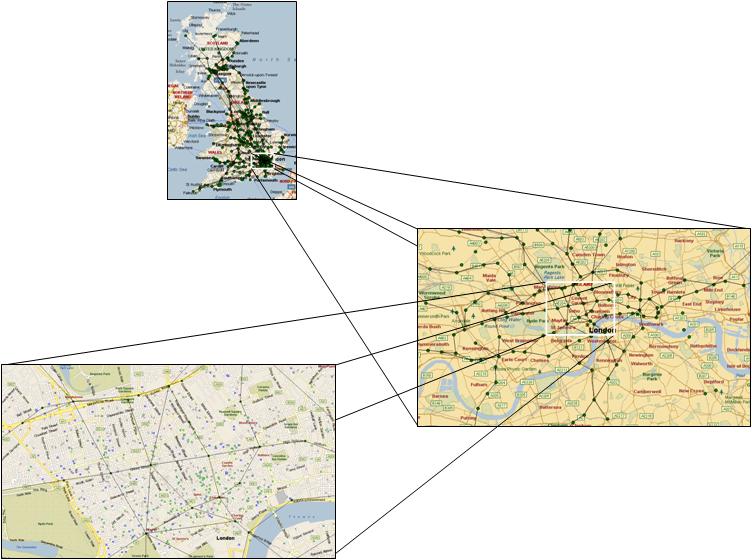
Mapping and Geographic Information Systems
Visual-tm uses MapPoint®1 which comes with a full set of UK and world maps, as its in-built geographic information system so that users can prepare their networks, zone systems and display their results using maps. Visual-tm also interfaces directly with MapInfo®3 and ArcView GIS4.
Visual-tm is Tried, Tested and Proven To Deliver
Peter has been developing other peoples transport modelling software since 1976. In 1988 he started Peter Davidson Consultancy for transport planning, railways, research and software. In 1991 he started Visual-tm software development with ERICA followed by networks, mode choice, stated preference and tools, with the distribution model being added in 2000. During this period it was used for dozens of projects including major schemes, highway models, LTPs, toll roads, airport access, new air services, freight and transport strategies.
From 2001 to 2003 it was completely re-engineered, re-written and re-tested. In 2004, we re-branded it as Visual-tm (short for Peter Davidsons Visual Transport Modeller) and re-launched it in May 2004 with version 2 (2005) and version 3 in May 2006. It has continued to deliver successful projects ever since.
In the past year, Visual-tm has been tried and tested on the following major projects: Ashford masterplan, Merseytram demand and revenue forecasting, Gloucestershire Regional Spatial Strategy, Gloucestershire major scheme bid and Truro major scheme bid.
The Rest of the Toolkit
Visual-tm comes with a complete set of tools for all those additional tasks such as matrix estimation, zone polygon editing, sophisticated roadside interview expansion so that expansion factors give useful variances, postcode address file to geo-code your surveys, dataviewer to connect your model to your LTP/ APR targets, the mode choice calculators for quick prediction of switch from car to park and ride, cycle or walk, origin-destination database fully integrated with DfTs ERICA5 matrix builder.
Why does Visual Transport Modeller Come in Different Editions?
Different types of user require different functionality. Visual transport modeller therefore comes in a number of editions, each aimed at a different type of user:
Visual Transport Modeller: Academic Edition
Some people want to try the software out before making a possible purchase, some may want it for teaching purposes and others may be just curious as to what transport modelling is all about. The free Academic Edition is aimed at these types of people.
Visual Transport Modeller: Professional Edition
We think that there are some transport modellers who want their own transport modelling software. They may want to develop transport models for their own purposes and can't afford the price of currently available commercial software. There may be people who could want it for a medium sized problem eg a town, city, corridor or region where there is not the data to support a large model. They may be not considering doing a model because it takes too much time/ data or because the size of the problem does not warrant a 'big' model. They may be considering doing something simple on paper or with a spreadsheet. Instead we may tempt them to considering implementing a simple transport model using Visual-tm's rapid model development capability. The Professional Edition is aimed at these types of people.
Visual Transport Modeller: Corporate Edition
If Local Authorities, Regional or National Governments have a model, they can keep it up-to-date without having a complete rebuild every 10 years or so. The model could grow as the need arose for greater detail, more market segmentation, as new types of transport solutions come along and as more is known about transport in their area. This will help them devise better solutions. If they monitor transport, it will help them monitor better and allow the results from their monitor to feed through to their transport planning to make it better still. These types of user may have a large problem size and may want other specialist tools. With Visual-tm they also have a superb way of retaining their transport data in an encapsulated transport database as a permanent resource for the future. This will enable them to develop progressively better transport plans (with or without a model). If they don't have a model and do not want to develop one, they could run tables and queries to get the transport statistics they need.
These types of user may wish to use disaggregate models to bring into their forecasts better models of behaviour (eg for road pricing, responses to congestion, peak spreading, park and ride and other more sustainable transport modes). These people may also need to monitor the green travel plans in their area with pd-Green. The Commercial Edition is aimed at these types of user.
Visual-tm works with ERICA5 for building matrices. Purchasers of the Corporate Edition may also wish to purchase ERICA5 and MapPoint Europe/North America. There is also additional capability for processing addresses and turning them into postcodes or grid references.
Visual Transport Modeller: ERICA5 Edition
This is aimed at people who want the specialist database functionality provided by ERICA5 and who do not require the full functionality of all the transport models. The Academic Edition is included with it.
Visual Transport Modeller: Accessibility Edition
This is aimed at people who want the specialist accessibility functionality provided by Visual-tm and who do not require the full functionality of all the other transport models. The Academic Edition is included with it.
Visual Transport Modeller: pd-Green Edition
This is aimed at users who want to develop and monitor their green travel plans and who have no need of transport modelling functionality.
(1) MapPoint is either a registered trademark or a trademark of Microsoft Corporation in the United States and/or other countries. (2) ARCADY, PICADY and OSCADY are registered trademarks of the Transport Research Lab (TRL). (3) MapInfo is a registered trademark of MapInfo Corporation, Troy, New York. (4) ArcView is a trademark of ESRI.
Back to Visual-tm home On to tutorials