
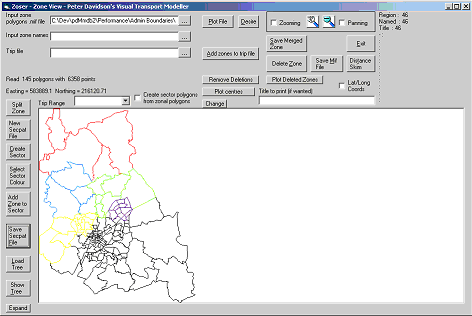
Desire Lines can be plotted in Zoser from binary Erica or Excel files on a background .mif format zone boundary file. The Performance Project in the Test Data includes suitable data for illustrating this. Open the project and click Administrative boundaries on the main menu to call up Zoser. Then open the zone boundary file by browsing to the Admin Boundaries directory and selecting the Chlzone4.mif file. Click the Plot File button and then click the Remove Deletions button to display the zones, which should appear as follows.
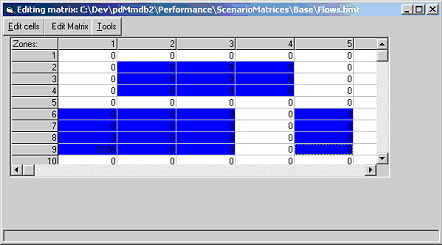
To get to the desire line form, click the Desire button and browse to the file to be plotted. This is ScenarioMatrices\Base\Flows.bmt. Put the number 1 in the market segment box and browse to the Chlzone4.mif file in the Zone boundary .mif file text box at the bottom of the form.
The line widths and line colours are set using the text boxes and picture boxes under the Flow Range, Line Width and Colour headings. The flows in the file are all below 250 so set up an appropriate set of colours and line widths. The form should appear as follows.
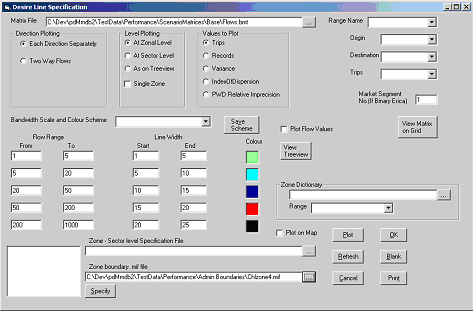
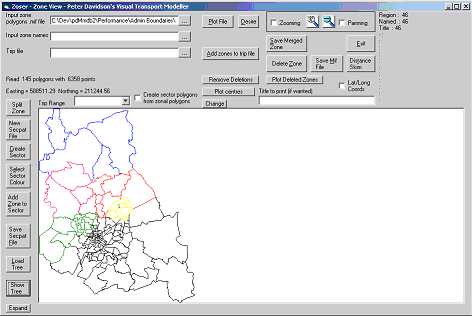
Click the Plot button and the main Zoser form should look like this.

Note that the zone numbers in the matrix file are linked to the numbers of the zones in the .mif file through the Region Number at the start of the section for each zone in the file. Also the Centre value at the end of each zone gives the coordinates that Zoser uses to start and end the desire lines. These therefore have to be correct. If the Centre lines are absent from the file, Zoser calculates a location for the centre.
Flows can be displayed using a separate line in each direction or by having the two added together. Also, the flow value can be shown alongside the line by ticking the Plot Flow Values tick box. For binary Erica matrices, the Records, Trips, Variance or Index of Dispersion values can be plotted. The Relative Imprecision option calculates the number of digits to the left of the decimal point in the index of dispersion and plots the line width and colour that correspond to this value.
The Zoser screen can be cleared in preparation for another plot by using the Blank button and it can be printed using the Print button. If any text is entered in the Title to Print text box on the Zoser main form, this will be used as the title for the print out.
The settings on the Desire Line form may be saved for future use by clicking the Save Scheme button. Enter a name for the settings (scheme) when requested and when you have finished using the form, close it using the cross in the right hand corner. This will ensure that the settings are saved and reloaded when the project is next opened and the desire line form called up. The required scheme is reloaded by selecting its name in the drop down box.
If the name of a binary Erica file has been entered in the Matrix File text box, it may be viewed on the pd-Edit grid by clicking the View Matrix on Grid button. If a Zone Dictionary is in use (see below) the edges of the grid will display the zone names instead of numbers.
Desire Lines in Excel
If the desire lines are to be plotted from an Excel file, browse to the file and then select the range or sheet containing the data. Then select the Origin, Destination and Trips columns.
Zone Dictionary
It is possible to have zone names instead of numbers in the .mif files. This requires the use of a Zone Dictionary, which is set up in a separate Excel file. The range with the data must have two columns, where the first has the names that are used in the .mif file and the second has the zone numbers in numerical order. The data to be plotted must always have zone numbers and not names.
Displaying Flows To or From a Single Zone
For greater clarity, the trips to or from a single zone can be displayed without showing any of the other trips in the matrix. For example, to display the trips from Zone 1 only, click the Single Zone check box under Level Plotting and enter the number 1 in the Zone No. text box. Select the From Single Zone option under Direction Plotting.
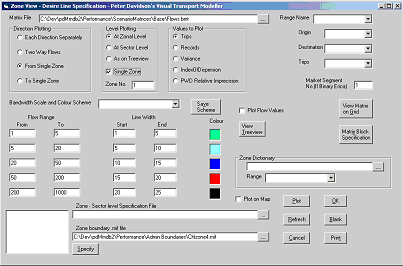
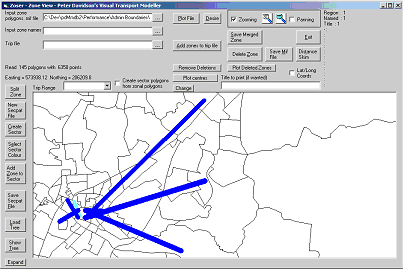
Click the Blank button to clear the previous display and then click Plot. The result will be as follows, after zooming in.
Plotting Desire Lines on pdNetwork
Desire lines can be plotted against the background of the network displayed on pdNetwork. This is done from pd-Edit and can be done from any file format that pd-Edit is capable of opening. It can also be done for any selection of O-D pairs in the file and not just for the whole file. The line widths and colours are determined by the settings on the Options form for plotting assignments, not by the settings on the Desire Line form.
The procedure is very similar to that described for doing assignments between selected O-D pairs at the end of Section 6.6.1. Open the matrix on the grid in pd-Edit. If the O-D pairs are in a single rectangular block on the grid, just select this rectangle and on the pd-Edit Tools menu click Plot Desire Lines. The results will be plotted on the network. If you need to select several blocks on the matrix, click Select Multiple Blocks on the pd-Edit Tools menu before selecting the required blocks on the grid. After selecting them all, click Plot Desire Lines on the Tools Menu. To plot the entire matrix, select the entire matrix on the grid.
An alternative method of block selection is available in Zoser with binary Erica matrices. Ensure that the matrix name is in the text box at the Matrix File text box on the Desire Line form and that the Market Segment has been selected. Click the Matrix Block Specification button to display the Matrix Block Specification form.
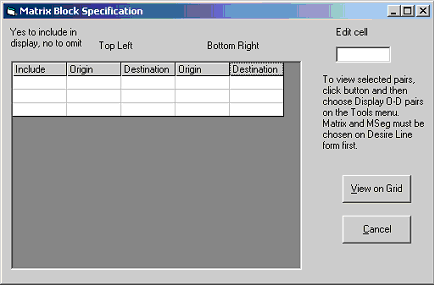
On this form you enter the top left and bottom right O-D pair numbers of each block that you wish to define. Click on the cell that you wish to enter a number in and enter the number in the text box. It is not possible to type numbers directly on the grid. Clicking on any row causes the word “Yes” to appear in the first column, which ensures that the block is saved to the output file for use in plotting. This may be changed to “No” by clicking the cell and entering No in the text box. The block is then excluded from plotting until the No is changed back to Yes. Clicking on the bottom row creates another row below it so that there is always more space available.
For example, the blocks of cells from 2,2 to 4,4, from 6,1 to 9,3 and from 6,5 to 9,5 are defined as follows:

With a suitable binary Erica file chosen on the Desire Line form e.g. the Flows.bmt referred to at the start of this section and the Market Segment number entered, clicking View on Grid will display the matrix on the grid. Click Display O-D pairs on the Tools menu to display the selected O-D pairs.
The View on Grid button saves the O-D pairs specified in Zoser to a file \System\Working\ODPairs.dat and then opens the named matrix. Display O-D pairs on the pdEdit Tools menu causes the specified O-D pairs to be selected on the grid. ODPairs.dat is overwritten whenever the View on Grid button is clicked so it may be useful to back up the file elsewhere for future use. The selected O-D pairs may then be used for plotting Desire Lines or for doing assignments using the items on the Tools menu.
Sector-to-Sector Desire Line Plots
A matrix with a large number of Zone-to-Zone pairs may be difficult to understand when plotted. The above method of plotting only selected O-D pairs from it or trips to and from a single zone are ways of solving this problem, but it is also possible to do the desire line plot in Zoser at sector-to-sector level to reduce the number of lines. This requires a .mif file to be loaded that is at sector-to-sector level. The secpat file linking the zone numbers in the matrix to the sector numbers in the .mif file is entered in the Zone-Sector level specification file text box on the Desire Line form. The Level Plotting should be set to At Sector Level.
The secpat file can be built on the Zoser display, if it does not already exist. To do this, first click the New Secpat File button and then click Create Sector and enter a number for the sector you wish to build. Click Select Sector Colour and select a colour from the palette. Any zone that is clicked will now change to this colour. Then click each zone you wish to add to the sector, followed each time by the Add Zone to Sector button.
Remember that to zoom in on part of the display, the Zooming check box must be ticked. Clicking and dragging to zoom in will not add the clicked zone to the sector. After zooming in, the Zooming check box must be turned off to resume adding zones to sectors.
To build the other sectors, click Create Sector and repeat as above until the pattern has been completed. Then click the Save Secpat File button and enter a name for the file to save. The following pattern has been saved to secpat.par in the Performance project’s Admin Boundaries directory. The north western part of the system has been grouped into five sectors.
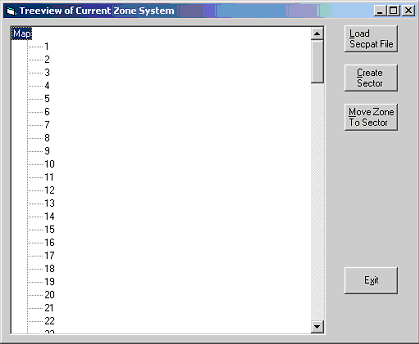
This sector pattern can be redisplayed on the zone background at any time by using the Show Tree option. Use the Load Secpat File button to browse to the secpat file and a Treeview structure will be displayed showing the sectors. Double click the Map node to reveal the sectors.

Clicking on one of the sectors will expand it to show its zones. When the secpat file is loaded, the sectors will be coloured in on the zone background as below. The colours are different as these are not stored in the secpat file and are assigned automatically as the file is read in.
It is also possible to build the secpat file by grouping zones on the Treeview, if this is preferred and if a zone name file was loaded when the .mif file was opened. The Chlzone4.mif file has a zone name file called Zonenames2.xls provided in the Admin Boundaries directory. Browse to it in the Input zone names text box and then select the range called zonename in the drop down box. Click Plot File and Remove Deletions as usual. On clicking Show Tree and double clicking the Map node, the zone names are all listed:
A sector is created by clicking Create Sector and then entering a name (not a number) for the sector. Then click each zone you wish to add to the sector, followed each time by the Move Zone to Sector button. Repeat until all required sectors have been built. The sectors are added to the bottom of the Treeview structure as they are created e.g.

Once the pattern is complete, use the Save Secpat File button on the Zoser form to save the pattern.
If a sector colour is selected on the Zoser form before creating each new zone on the Treeview, zones will change to this colour on the Zoser display when they are moved on the Treeview. Note also that if the Treeview is set up with the zone names, then building sectors by clicking on the zones on the Zoser display as described earlier will cause the same sector pattern to be built on the Treeview. In this case the sector names will consist of the word “Sector” followed by the sector number that was entered. The Treeview and Zoser displays therefore mirror each other’s changes, but the Treeview is only active if zone names are loaded. This is because it uses the zone names to create the individual zone nodes.
Desire lines can be plotted on a sector pattern set up on the Treeview. In this case there is no need to enter a secpat file name on the Zone-Sector level specification file text box on the Desire Line form. Just tick the As on Treeview option under Level Plotting.
Plotting Desire Lines on pd-Map
If the Plot on Map check box on the Desire Line form is ticked, the desire lines will be saved to a file called pdMapDesire.xls in the project’s System\Working directory. This file can then be plotted in pdMap by using the Plot Desire button and browsing to it.