![]()
![]()
![]()
![]()
![]()
![]()
![]()
![]()
visual transport modeller: assignment
![]()
Back to version 2 walkthroughs On to mode choice models An assignment is a method of allocating and plotting traffic flows to any model network. It outputs an Assignment.xls, which is a file listing all the links and their flows. A link validation can be run to compare the observed flows with actual counts.
To run an assignment, choose 'Models' then 'Assignment' to bring up the following form.
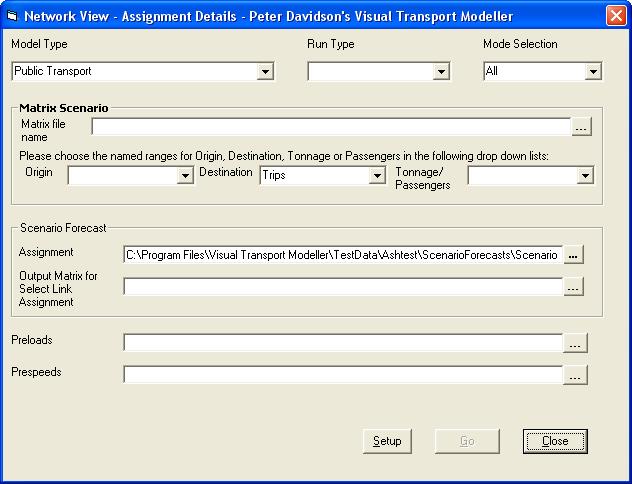
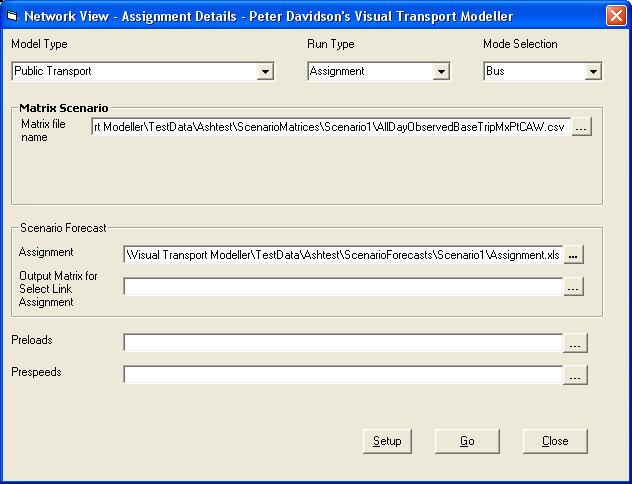
The type of assignment to run is selected from the first drop down list. The run type is selected from the second drop down list. A skim mode is not entered for a highway only assignment. If you wish to run a public transport assignment with bias towards one particular mode then choose this mode from the third drop down list. The correct matrix needs to be entered into the form along with the market segment and whether to use records, trips or variances if it is in binary erica format. The output location of the Assignment.xls also needs to be entered, and the preloads and prespeeds if required.
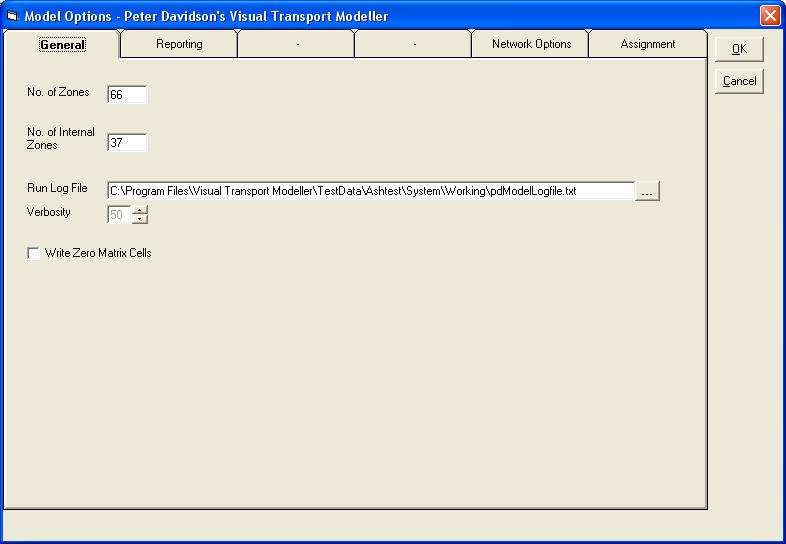
The Setup button brings up the form which specifies the model options. On the General tab the number of zones needs to be entered.
On the Assignment tab select the Car and Walk modes.
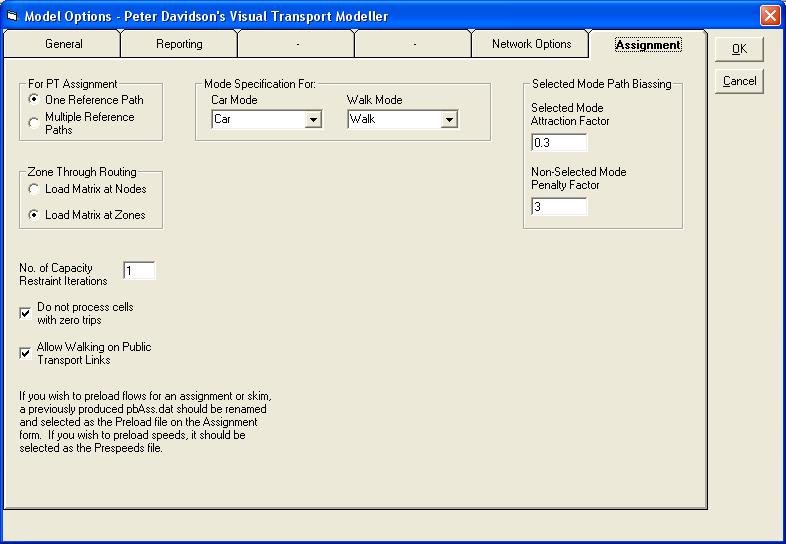
Press 'OK' then click 'Go' on the assignment form.
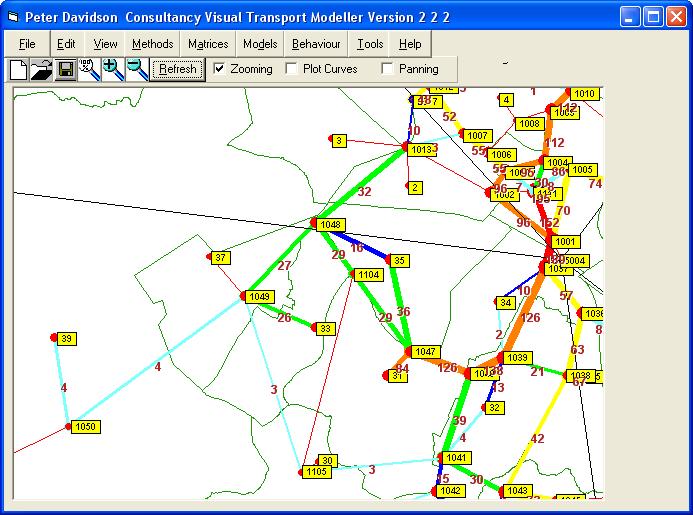
This will plot the assignment on to the network and produce an Assignment.xls which contains the flows on all the links in the network.
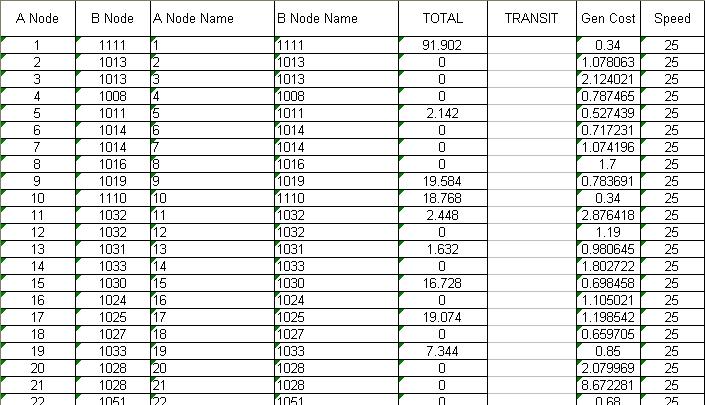
Viewing Flows
If you wish to view the flows of an Assignment.xls that has already been prepared, then the View button in the software has the option Flows. Here you can browse to the location of the Assignment.xls that you want to view and once you have found it click Load. A series of flows that are on the links will then be plotted on the network. You can change the colours and thickness of the lines with regards to the varying flows by going into the display options window and the Assignment bandwidths sheet and here you can change the numbers for the thickness or click on the colours to change them.

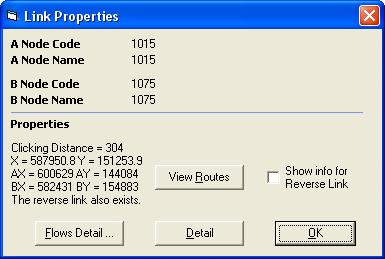
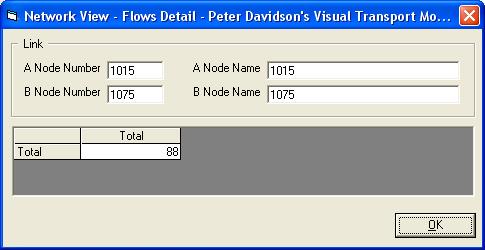
When an assignment has been plotted you can also check the flow details, distance and various other details of links by clicking on the link.

In order to get the names of all of the zones and nodes labelled on the software display you can click on 'View' and then 'Display Options'. In the options window you need to be on the plotting tab, then click in the box where it says node names and click on 'Automatic'. This will enable you to see all of the names of all of the nodes on the map providing the screen has zoomed in sufficiently to fit all the node names on.
Back to version 2 walkthroughs On to mode choice models