![]()
![]()
![]()
![]()
![]()
![]()
![]()
![]()
visual transport modeller: display overview
![]()
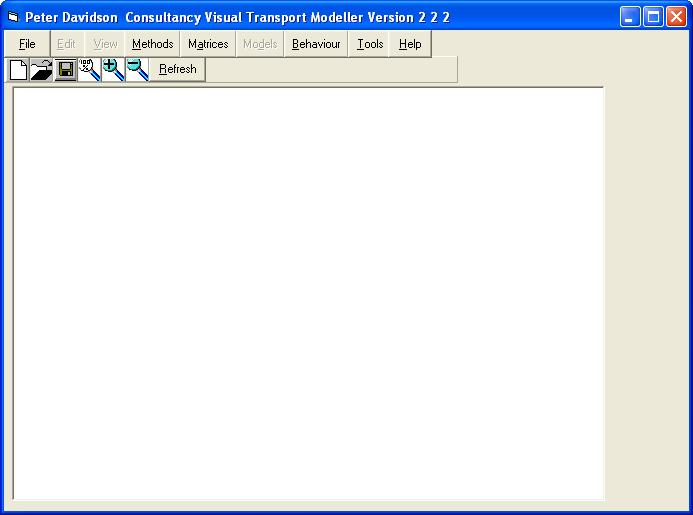
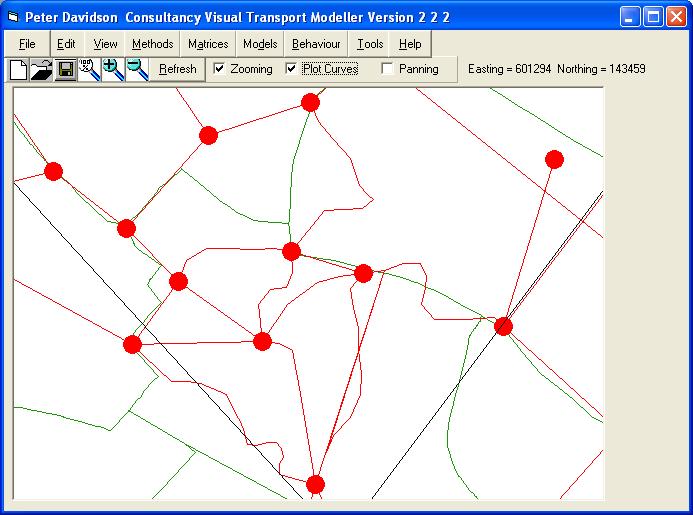
Back to version 2 walkthroughs On to selected menu functions Below is the opening and main screen for Visual-tm. At the top of the screen is a menu bar. Initially the only options you can choose are File, Methods, Matrices, Behaviour, Tools and Help.
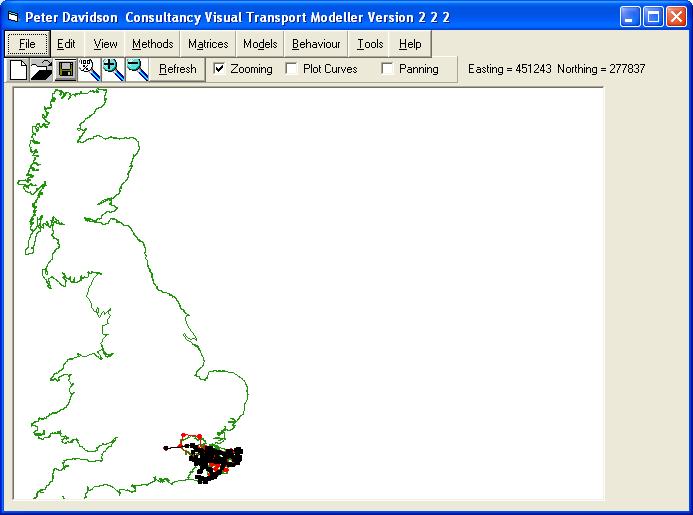
The first stage is to open a project. Lets begin by opening the Ashtest project. Either click File/Open Project on the menu bar or click the Open Project button in the Toolbar. The Open Project dialogue box appears. Navigate to the location of the test data that you have unzipped as a part of the installation process. Select the Ashtest project and locate the TransportDatabase.pdc file. Select this and click Open. After a few seconds (depending on the processing power of your computer), a graphical representation of the network will be built on the main screen (shown below).
All the Menu items at the top of the screen are now enabled and we are ready to begin. Firstly I will explain the other tools on the main screen.
There are 3 checkboxes which when activated have the following functions:
Zooming This allows the user to click and drag a square on the map. When the mouse button is released the map will zoom in to show the area of the square chosen. Try it. Using the left mouse button, click near an area of interest and drag.
See how the map zooms in when released (below).
You can click the Zoom 100% button on the Toolbar to return to the original view.
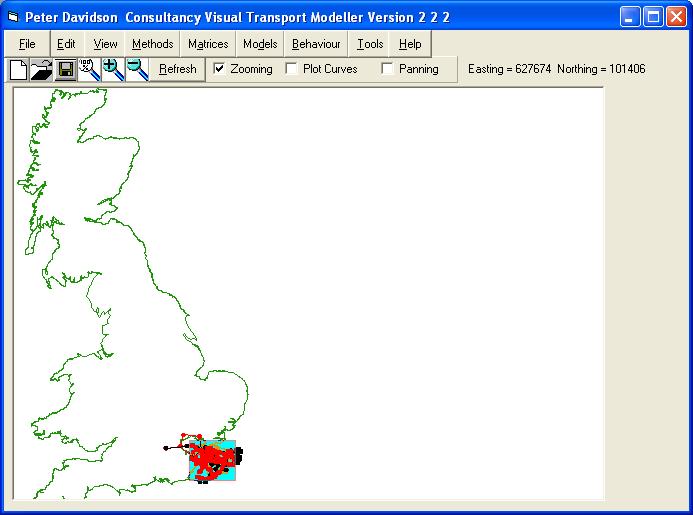
Now you have zoomed in you can see the network more clearly. The road network is displayed graphically by a series of red dots and lines. Each red dot depicts a node in the network, each line depicts a link between 2 nodes. The rail network is plotted in a similar way, with black squares for the nodes and black lines for the links. Also plotted is a background that shows the zone boundaries.
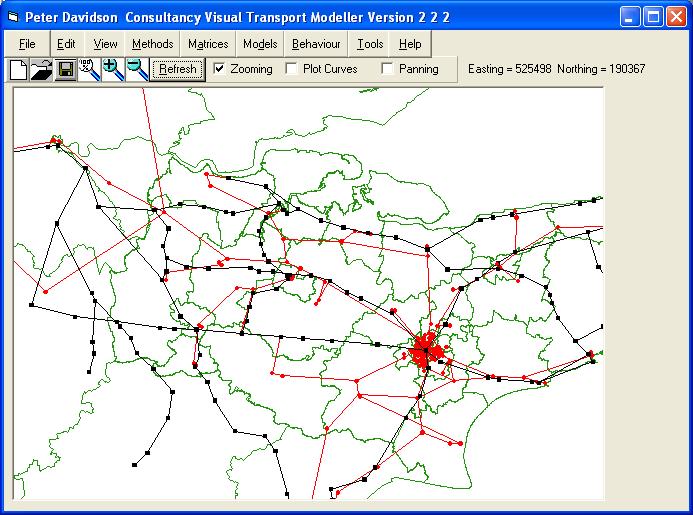
Plot Curves As you can see, the lines currently drawn on the map are straight lines. It is possible to create a curves file that shows the actual route of the roads. Select the Plot Curves checkbox and note how the links change. Only the centre of the Ashtest data network (shown below) is set up to demonstrate this.
Panning The Panning button enables the user to pan across the map at will. Highlight the Panning checkbox. Now zoom in on an area. Panning is now achieved by right clicking on the map and dragging in the direction you want the map to move. Try it. In a matter of minutes you should be very confident in moving around the map.
To the right of the 3 checkboxes an Easting and Northing co-ordinate are displayed. This is the position of the mouse cursor. As you move the mouse around the Easting and Northing values change. This is a useful tool when trying to locate a specific place on the map.
Back to version 2 walkthroughs On to selected menu functions