![]()
![]()
![]()
![]()
![]()
![]()
![]()
![]()
visual transport modeller: selected menu functions
![]()
Back to display overview On to macro section This walkthrough looks at selected functions of the software. Other areas are covered in more detail in their respective walkthroughs.
The Menu
File Menu
The File menu contains all the usual tools for opening and saving files, as well as offering the same for the scenarios built in your model.
Edit Menu
The edit menu allows for copying and pasting of matrix entries (more in a later section) and provides the entire range of tools needed to edit a network on the screen. Adding and editing nodes and links is simple to do in Visual-tm. As a brief example (Ensure that you have a file open), click on Add new link then click on the two nodes the link will connect. Click OK on the dialogue box which pops up then a second one will appear which offers you the chance to input the full range of information about the link you are creating, from its infrastructure type to its speed flow curve.
Click Save record then click Save in the next dialogue box to add the new entry to the database. Refreshing the screen will allow you see your new link.
View Menu
The View menu contains a variety of important Visual-tm functions. The first one is the Database option which opens the Dataviewer. Data is stored in Visual-tm in a simple hierarchical way. There are up to ten levels of databases, each level may have a number of databases contained within. The Dataviewer operates within Visual-tm where it holds the data as a consistent set of databases. It provides tools for viewing, editing, adding additional fields, tabulating and outputting data as well as for calculating performance indicators.
By selecting a database and clicking the Go Into Database and Back Out of Database buttons, you can view the contents of each database in the model, as listed on the left of the window. There is an alternative method of viewing a database using the Project Tree option, selected from the View menu.
In this form you can currently see Data Structure. Double click on it to expand. This now shows the databases loaded into this project. Simply click on the + signs to expand further.
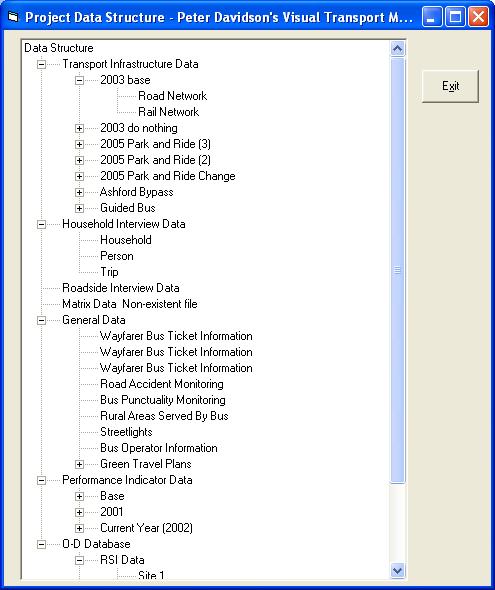
You can double click on a specific data item to open the Dataviewer and display the data that was selected. (To open the Dataviewer at any stage, simply click View/Database on the main Visual-tm form.)
Administrative Boundaries
The Administrative Boundaries option allows you to import a .MIF file with ward boundaries (or whatever zoning system you prefer) to create the zones in your Visual-tm model with full control over the implementation of this process.
World Map
The advanced mapping functionality of Visual Transport Modeller requires MS MapPoint to be installed on the users machine. If using MapPoint 2004, you must reinstall MapPoint after you have installed Visual-tm or this function will not work, but MapPoint 2002 will work immediately. The Ashtest test data set can be used to illustrate the use of the map display.
Open the project and click View/Map. Wait while the nodes are plotted and the following should appear:
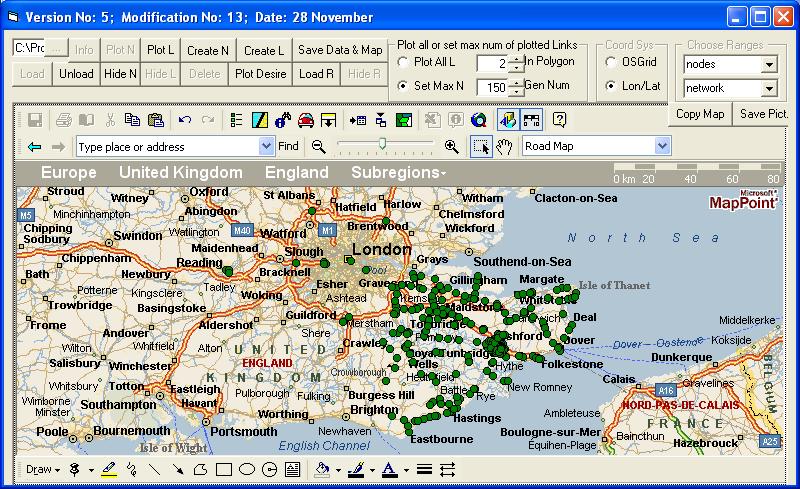
On loading, the map zooms in automatically on the network and plots only the nodes. Plotting the links takes longer and is done by clicking the Plot All L option button and then the Plot L button. The links are plotted as thin black lines. If you click on a node and then click Plot L, a small number of links around the selected node will be plotted. This option may be preferable if you have a large network and are only interested in a small part of it at the time, as it may take a long time to plot all the links. The nodes and links can be hidden by using the Hide N and Hide L buttons and redisplayed using Plot N and Plot L.
The two magnifying glasses just above the map zoom in and out by fixed amounts. The square with the arrow next to Zoom In will zoom in on a region of the display selected by the user. Click and drag across part of the map and the click within the box that this defines. For the network around Maidstone, the following is seen if the links have been displayed.
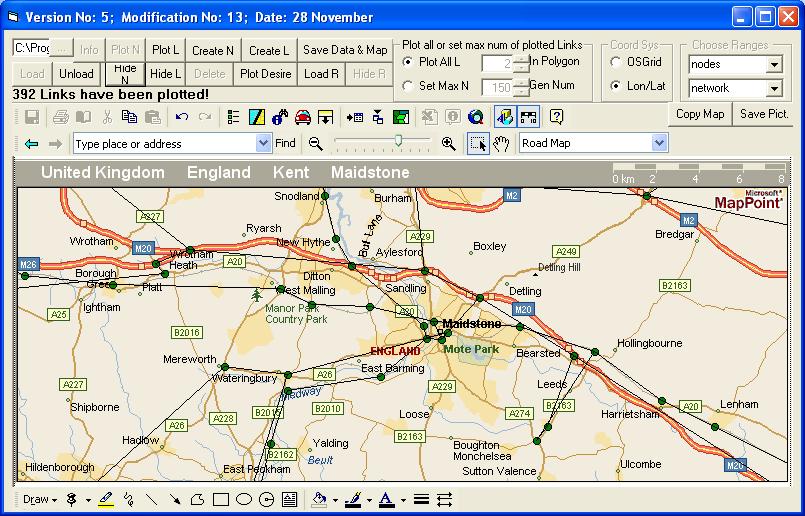
Clicking on the hand symbol allows you to pan across the map and if a node is selected by clicking it, the information button will cause its name and coordinates to be displayed. The Info button will display its node number and mode number. To select a link, it is necessary to press the Ctrl button when clicking the link. The Info button will then give its ANode and BNode numbers and its mode number.
The Map provides an easy way of modifying networks, as nodes can be moved, created or deleted and links can be created or deleted. These operations provide everything necessary to build a network and are a convenient way of doing it, especially if the node coordinates are not known.
Zone boundaries can be plotted in the map display if they are held in a spreadsheet or a Map Info .mif file. The Ashtest data includes an example of a Region file, containing ward boundaries in the Bristol area. It is called Regions.xls and is in the projects Admin Boundaries directory. Click Load R and browse to this file. The boundaries are displayed and the area within then is displayed with a light blue background. The Hide R button removes this coloured background and the Unload button removes the boundaries.
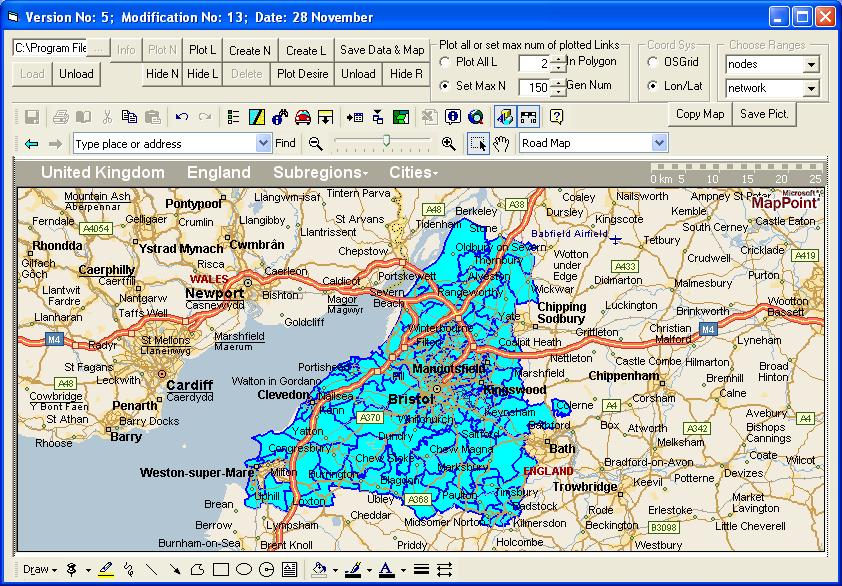
Individual zones can be selected and the selected zone will change colour. Holding down the Shift key enables a group of zones to be selected and holding down the Ctrl key allows zones to be removed from the group. A zone can be deleted from the display by holding down Shift and Ctrl and clicking the Delete key.
Display Options
The Display Options dialogue box allows you to alter the colours, thicknesses and sizes of your nodes and links, as well as providing control over the display of node names, bandwidths resulting from highway assignments and a range of other properties which are easily explored.
Model Options
The Model Options dialogue box allows you to alter basic properties of your model; the screenshot below illustrates some of these options, including the speed at which the model will assume people walk at and various properties of your public transport networks. Most of these are self-explanatory.
Find Node/Link
Find Node and Find Link allow you to locate nodes and links using their number in the database and are very simple functions to use, as clicking on one of them will demonstrate.
Methods Menu
Macros allow users to pre-record sets of actions within Visual-tm and call programs in order to interact with other applications (such as MapInfo). They are powerful tools, and are used extensively in the Macro section of the walkthrough to demonstrate some of the more advanced functionality of Visual-tm. It is recommended that you take a little time to go through this demonstration.
The Cordon Network option is a useful tool for validation, it simply looks at a cordon you specify and works out which links in your network cross the cordon, vital information which is just a few clicks work in Visual-tm.
The Matrix Building option accesses ERICA5, the most powerful databasing software in the transport modelling field. It makes maintaining and updating your databases and models simple, this piece of software is also available in standalone form.
Census Matrix Tools is a piece of software that exploits the 2001 Census data and several other large-scale surveys to allow you to build an origin-destination matrix for work trips for any part of the UK. It was built by Peter Davidson Consultancy for the Department for Transport, and is available for purchase from us separately from Visual-tm, though can be launched from within it via this option.
Calculators
Visual-tm contains 4 simple mode choice calculators to enable the user to quickly enter variables and view results to specific modelling queries.
Please note that these calculators use average UK coefficients from experimental measurements they are useful as a general guide only.
To open any of the calculators click Methods/Calculators followed by the calculator required.
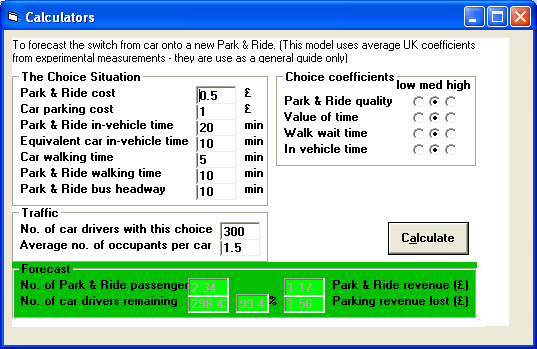
The Car versus Park and Ride Calculator is a piece of software that can be used to calculate modal shift from car to a new Park & Ride scheme. It takes into account factors such as journey time, fares and parking costs. It is based upon Peter Davidson's Demand Forecasting section of the "Good Park & Ride Guide", a publication of the DfR and the English Historic Towns Forum.
Similar calculators exist for car use versus cycling, car use versus walking and rail use dependence on fares.
Models Menu
The Models menu offers an array of functions required to carry out assignments on your model and gain useful information from the output. For example, the Accessibility option calculates the DfTs accessibility target for you, and is demonstrated in detail in the accessibility walkthrough.
The Two Mode Four Stage and Multi Mode Four Stage options are the dialogue boxes where you specify all the matrices containing information about your model in order to carry out a four stage assignment.
The Benefits option calculates the benefits each scenario offers compared to the Do Nothing in whatever terms you choose to specify, such as in car in vehicle time or walk time, reducing the task to the completion of a few fields:
Matrices Menu
The Matrices menu contains the full range of options to create and edit matrices, with most functions being straightforward to use. A couple of features are detailed below.
Visual-tm provides a simple method of performing matrix calculations. Go to Matrices | Matrix Calculations | Matrix Calculations to view the window. Inserting an output filename and the two input filenames and choosing your operation is all that is required to perform any simple operation.
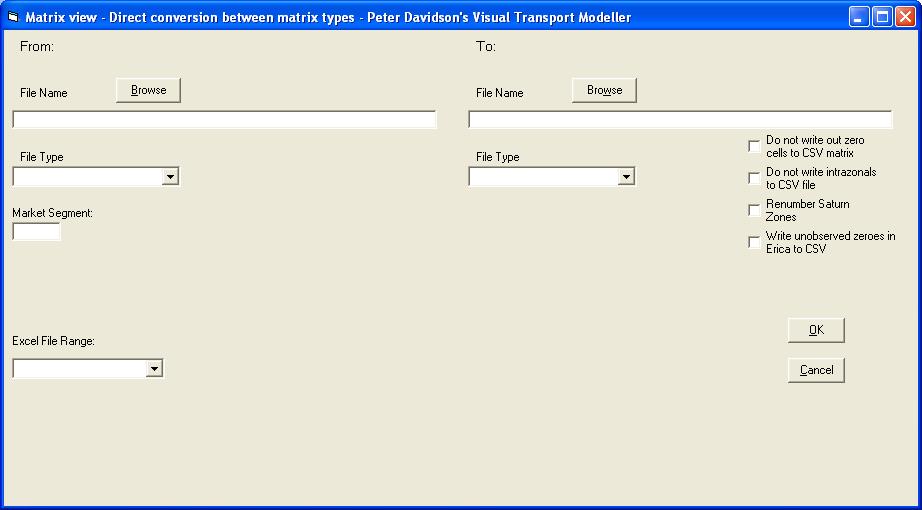
It is possible to convert certain matrix types directly into certain other matrix types without having to open the matrices on the grid and save them from it. This is particularly useful for large matrices as these take time to load up on and save from the grid display. To do this, choose the Convert option from the Tools sub menu on the Matrices Menu. The form that is displayed has text boxes and browse buttons for inserting the names and paths of the input file and the output and a box in which the Market Segment of a binary ERICA matrix to be converted must be entered if it is to be converted to SATURN or TRIPS. For the other output types, all Market Segments in a binary ERICA matrix are converted.
A printed ERICA matrix may be converted into a binary ERICA matrix. A binary ERICA matrix can be produced from a printed ERICA matrix, a Saturn matrix, an Excel database file or a Comma Separated Variable (CSV) file.
An Excel database file may be converted to a binary ERICA matrix where an Excel database file is taken to mean any Excel file in which trip data is written on consecutive rows.
A binary ERICA file can be converted to CSV format. A single market segment can be converted to a file in the form Origin, Destination, Trips or a number of consecutive market segments (MSegs) can be written out in the form Origin, Destination, MSeg X, MSeg Y etc. The required Market Segment or range of Market Segments e.g. 2-7 is entered in the Market Segment text box.
There are several options specific to conversion from binary ERICA to CSV files. The Do not write intrazonals to CSV matrix tick box will prevent any intrazonal O-D pairs in the binary file from being written to the CSV file. The tick box entitled Do not write out zero cells to CSV matrix will prevent an O-D pair from being written to the CSV file if none of the required market segments have any trips for that O-D pair. If the Zone Dictionary option is used, the CSV file format will be as described above except that the zones will be renumbered as specified.
Behaviour Menu
The Behaviour menu contains menus to deal with the results of stated preference (SP) and revealed preference (RP) surveys.
The SP and RP Analysis option runs a program called sp-Analyse which uses SP and RP survey results to build the parameters needed for modelling.
Tools Menu
The DOS Command Window allows you to run other modelling software within Visual-tm, and Visual-tm provides the means to simply convert files from Trips, Saturn or Emme 2 into our format so none of your work in constructing previous models goes to waste.
The Privileges option is a way for senior modellers to protect networks from those with less experience. By setting someone as a user you can limit their ability to alter a network or edit some of the network properties and avoid inadvertent damage to your data.
Select and Save Node and Link Set allow you to run assignments on sections of your network. In order to do that you must specify which nodes and links of your network you want to use these functions.
You can now see some of these functions in action using some macros specially written to demonstrate the power and functionality of Visual-tm.
Back to version 2 walkthroughs On to macro section