![]()
![]()
![]()
![]()
![]()
![]()
![]()
![]()
visual transport modeller: Matrix building
![]()
Back to version 2 walkthroughs On to Networks Matrices can be built to derive the number of trips made between every zone or sector. In this walkthrough we will look at building matrices from roadside interview files. In addition to the roadside interview (RSI) sites themselves three more files will need to be prepared for the building process.
Staseg.csv
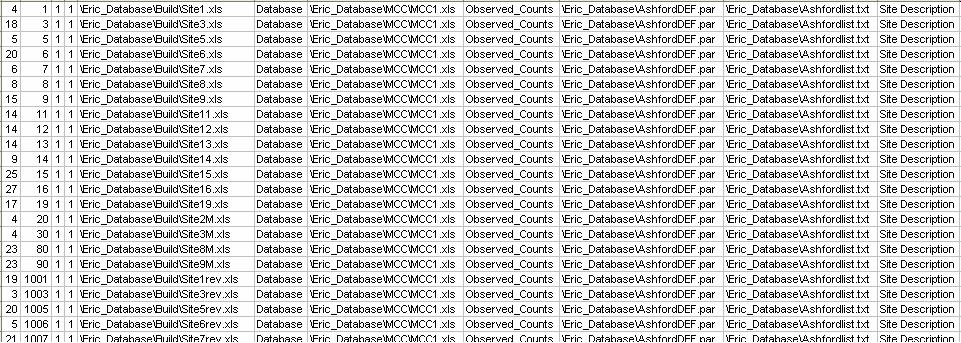
All the roadside interview data files are called up by this file in which all the segment, station and parameter file details are listed. This is a comma separated variable file with 11 columns, which contain the following data: Segment no; Station no; Station factor; Station variance factor; RSI data file; Range in RSI data file; MCC file; Range in MCC file; RSIdef file; list file; Site description.
Secpat.csv
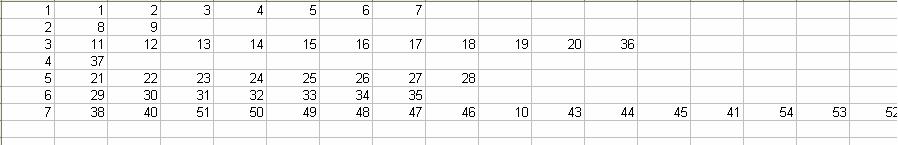
The secpat indicates which zones are assigned to which sector. Sector numbers are entered in the first column; zone numbers are then listed in the following columns. Hyphens can be used to group consecutive zones, eg. 1-4 for zones 1, 2, 3 and 4.
Ercodm.csv
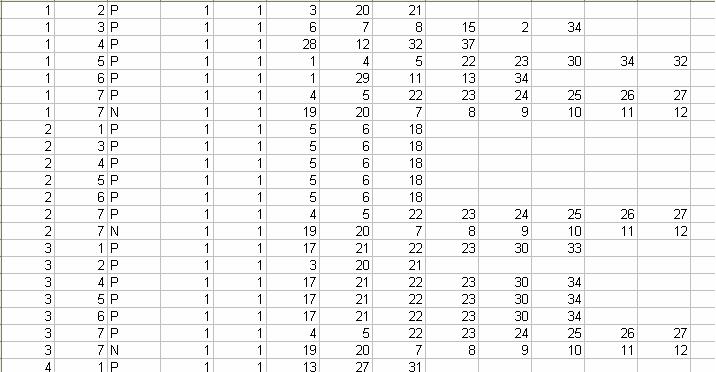
This file is used to define the ERICA cordons; for each sector to sector movement defined there is at least one cordon specified. Each cordon should form a complete barrier around one of the specified sectors. The columns in this file should contain: Origin sector; Destination sector; Positive or negative; Cordon no; Factor; Screenline segment 1; Screenline segment 2; Screenline segment 3 etc.
To enter Erica, choose 'Matrix Building' from the methods menu. Click 'Build RSI Matrix' to open the following form: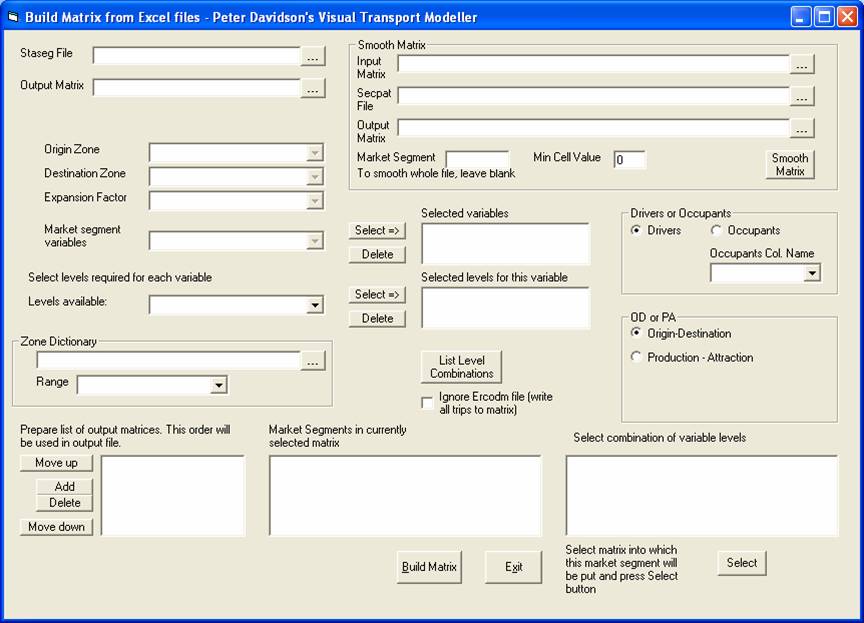
The fields that must be entered into the matrix building options window are the correct staseg file, the desired output file name and location, the origin zone, destination zone and expansion factor column headings in the RSI files. Other options are explained later.
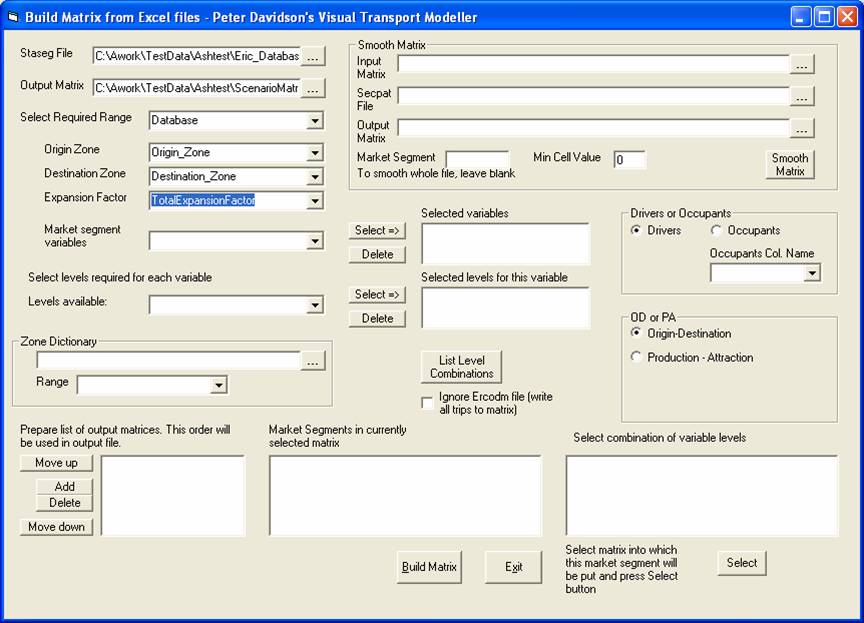
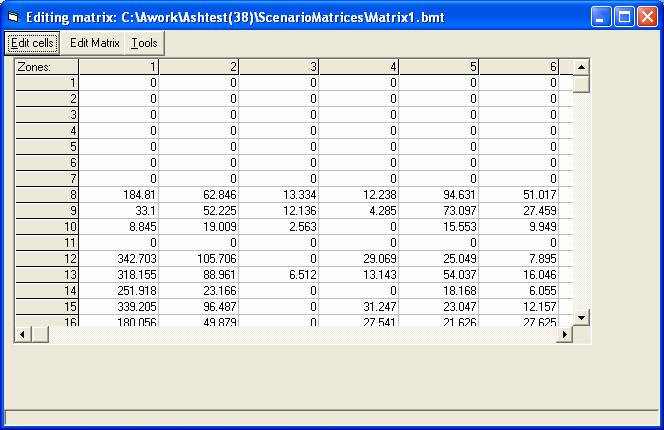
Click 'Build Matrix'. This produces a matrix showing all the trips at zonal level.
For RSI data processing, quality checks are conducted and if necessary, changes are made such as assigning a 0 to the UseData column of unwanted records. The process can then be repeated from the Expansion stage (see roadside interview processing walkthrough).
Market segmentation
If a field is required for market segmentation, there must be a range with the same name as the field in the first data file listed in the staseg file. This range must have the same name as the field and should give the name of each value that the field can have, listed in numerical order in the first column of the range.
On selecting the field in the Market segment variables box, these names will be listed in the Levels available combo box. If the necessary range does not exist, a message will be displayed. Select one of the required levels and click the Select button next to it to add it to the Selected levels list. It can be removed using the Delete button if it was added by mistake. Select the rest of the levels required for this variable and when they have all been chosen, select the next variable required from the Market Segment variables combo box and proceed as before.
Using the test data as an example, fill in the Build RSI Matrix form as described above. Now select Time_Period in the Market segment variables drop down box, click Select and then choose AM_peak in the Levels drop down box and click its Select button. Then choose PM_peak and Select. The form should look like this:

Now select Vehicle_Cat from the variables drop down box, click Select and then choose Car, MC, LGV from the Levels available list followed by HGV.
When all the required variables and their levels have been chosen, click the List Level Combinations button. This will list all possible combinations of the selected variable levels on the list headed "Select combinations of variable levels". The required combinations can now be linked to Market Segment numbers in the output Binary Erica matrix. To do this, click the Add button and enter a name for the first market segment. Select it in the list and then select the combination of variable levels in the list that is to be written into it and click the Select button below the list. If any other combinations of levels are to be added into it, select them in the list one at a time and click the Select button. Any number of combinations may be added together in a market segment.
When all choices have been made for a market segment, click the Add button and enter a name for the next market segment. Proceed as before until all market segments have been created. Unwanted market segments may be deleted and the order of the market segments may be changed using the Move up and Move down buttons. The final order will be used in the output matrix.
Continuing the above example, after clicking List Level Combinations add a matrix called AM and then select "AM_peak Car,MC,LGV" from the combinations list and click Select. Then click on HGV and click Select. Now add a matrix called PM light and select PM_peak Car,MC,LGV. Add a third matrix called PM heavy and select HGV. The form should now look like this:

When everything has been set up, click the Build Matrix button. The output matrix will have three market segments, with the first having the trips made in the AM peak. The second has the PM peak trips made by car, motorcycle and LGV. The third has the PM peak trips made by HGV.
Other options
Matrices can either be built according to the number of drivers (i.e. trips by vehicle) or the number of passengers. They can also be built as either Origin-Destination or Production-Attraction matrices.
Back to version 2 walkthroughs On to Networks