![]()
![]()
![]()
![]()
![]()
![]()
![]()
![]()
visual transport modeller: Roadside interview data
![]()
Back to version 2 walkthroughs On to Matrix building Data preparation
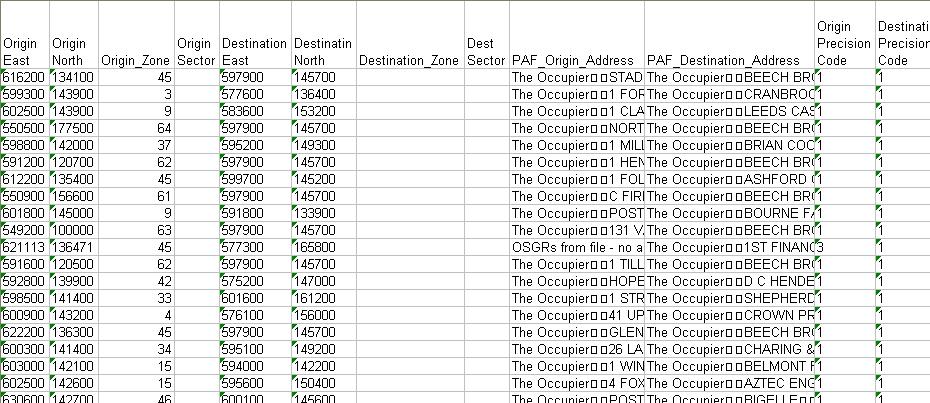
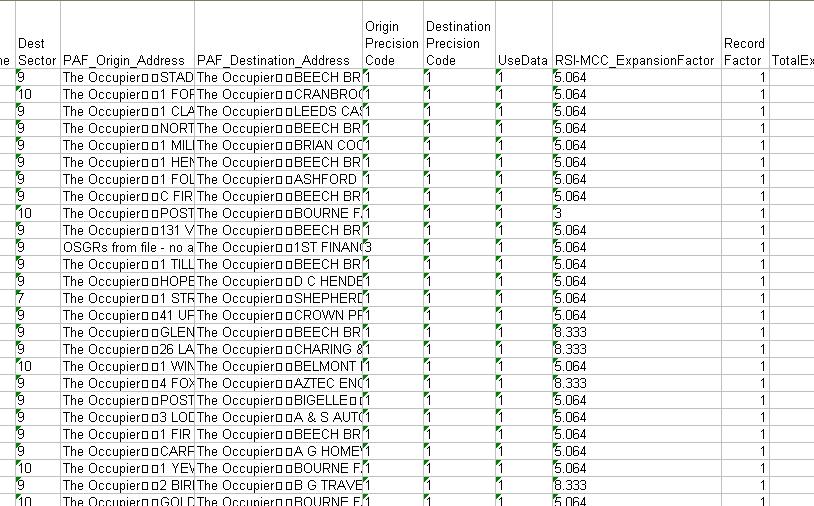
This file is a spreadsheet that contains all the records for one particular Roadside Interview (RSI) site in the Ashtest project. All such files for this project can be found in the Eric_Database\Build directory. The spatial data consists of the Origin postcode and Destination postcode.
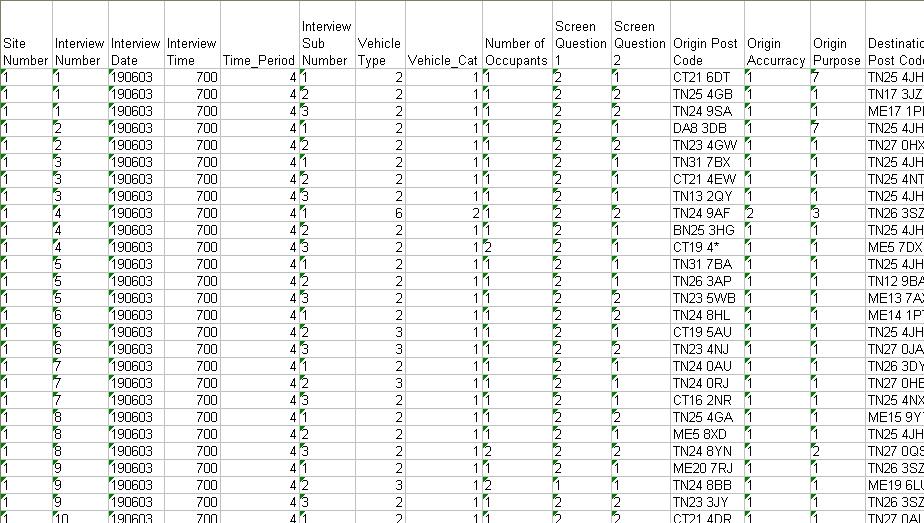
The other columns make up any additional market segmentation data, such as Interview Time, Origin purpose, destination purpose and any screening questions that may be asked.
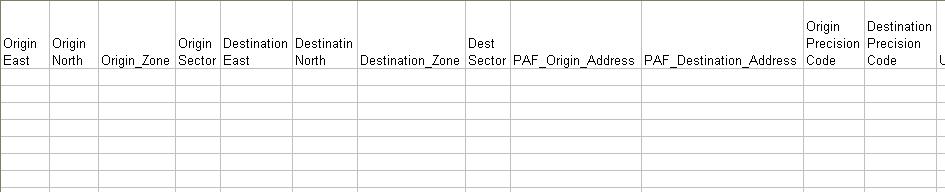
Range and logic checks are conducted to ensure all the fields have been entered accurately, if at all. Extra columns need to be added to the file so that the subsequent processes have somewhere to output their data. (Note that these columns have already been filled in in the Ashtest project.
Geo-coding
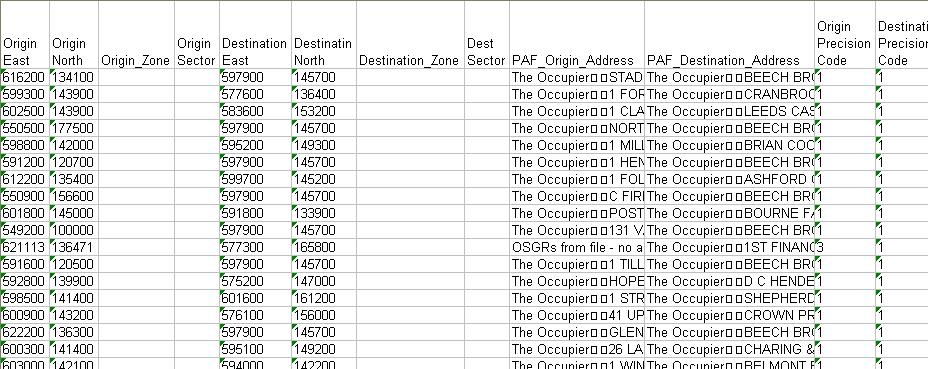
The eastings and northings need to be found for each origin and destination postcode, using Visual-tms Address Matcher along with the Royal Mail Postal Address Finder Database.
This file is specific to the UK. It creates an output containing the postcode, address and grid reference of a specified place.
If exact postcodes cannot be found then we reference them to a postcode sector or area and assign a generalised grid reference. Precision codes are allocated to denote the accuracy of each grid reference.
Once the grid is processed, the postcodes and their corresponding grid references can be saved to the RSI file.
Ultimately we wish to assign zone codes to each origin and destination. However, it is possible that the zones may later be redefined to a finer zone system. If this is the case, then having ready assigned grid references makes the task of reallocating the zone codes quicker and easier.
Zone coding
The zone coding part of Visual-tm is used to allocate the zones. The software reads the grid references and plots them in the database.
Click 'View' then 'Admin Boundaries' to open the following form:
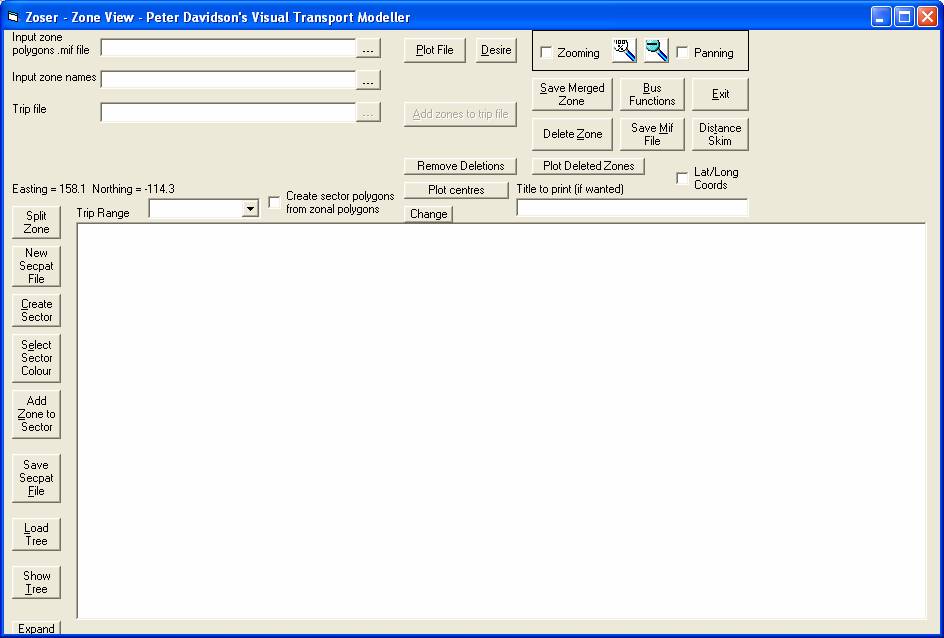
Browse to the input zone polygons .mif file. Click 'Plot File' then 'Remove Deletions to display it on the screen. Next browse to the Input zone names file and select the range which contains the zone names. Next browse to the Trip file and select the Trip range followed by the Easting, Northing and Output Zone ranges.
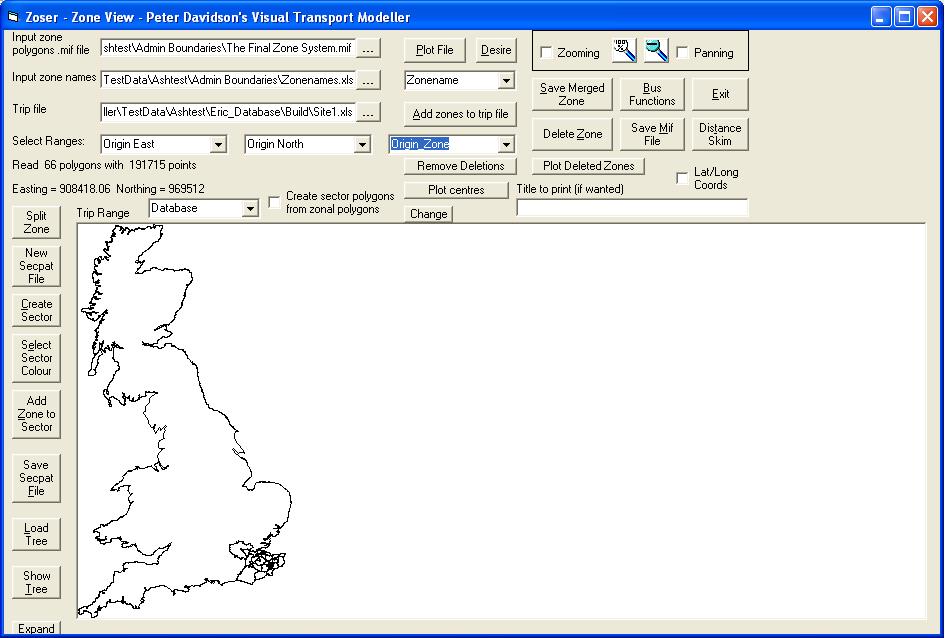
Click 'Add zones to trip file' and the zones are recorded and saved in the output file.
The origin and destination sectors can be found directly from their zones using lookups.
For any records with unobtainable grid references, and subsequently no allocated zones, a 0 is applied to the UseData column in the RSI file.
Transposing
Since RSI sites only account for traffic flowing in one direction, the sites can be transposed to account for traffic in the opposite direction. Generally the am peak is swapped with the pm peak and the journeys from home are converted to journeys to home, and vice versa. To open the form to do this, click 'Methods' then 'Matrix Building'. Click to view the Staseg file, then click 'Reverse RSI file'.
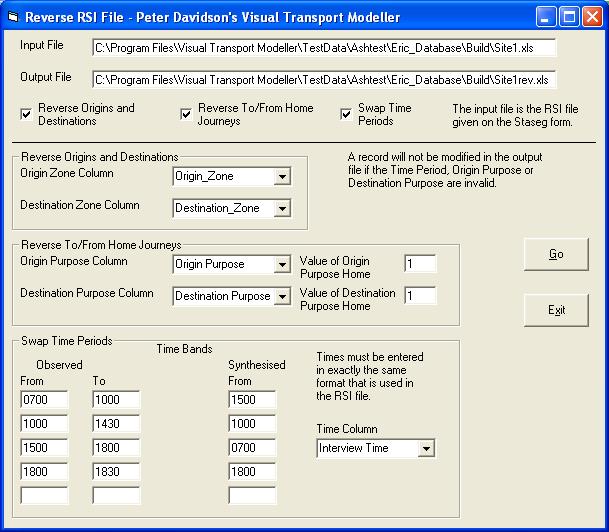
The screenshot above shows the form filled in. Click 'Go' to transpose the file.
Expansion
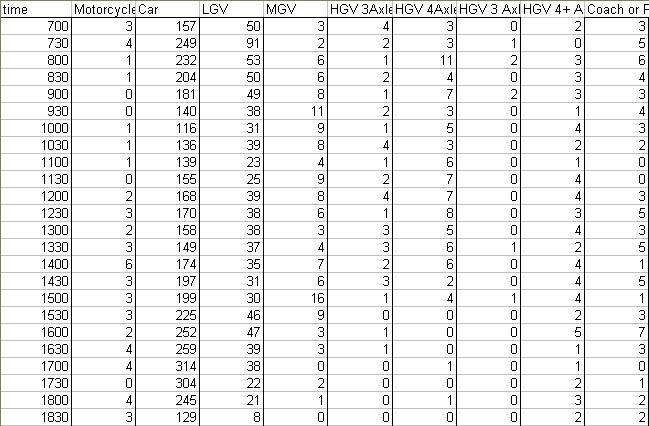
The RSI site data now needs to be expanded to equal the Manual Classified Count (MCC) for that site. Any records with a 0 in the UseData column of the RSI files are not used in this process.
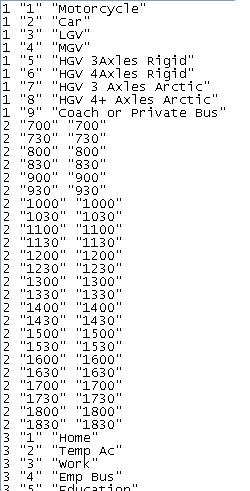
The MCC file shows the count for each type of vehicle at each time period. The columns are arranged so that similar vehicle types are next to each other. This is to help with blocking, which is explained later.
List.txt indicates the different market segments for the project.
If a particular cell has no MCC or RSI, then it will produce an expansion factor of either zero or infinity, respectively. The cell will need to be blocked by merging it with neighbouring cells, preferably in the same vehicle category. Blocks are created by dragging the mouse from left to right/top to bottom.
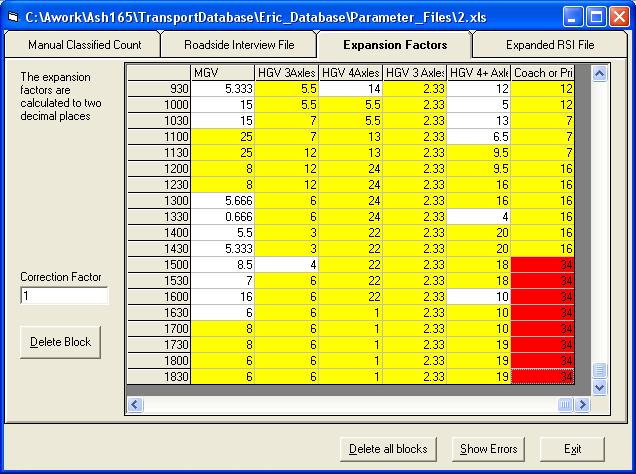
Blocks should be kept as small as possible, preserving key time periods, for example the am and pm peaks, otherwise appropriate vehicle types will have to be merged together. The same procedure is applied, where possible, to any cells that produce expansion factors of less than 1 or greater than 30.
The expansion factors are output to the RSI-MCC_ExpansionFactor column in the RSI file. Its total should equal the total MCC for that site.
Back to version 2 walkthroughs On to Matrix building