![]()
![]()
![]()
![]()
![]()
![]()
![]()
![]()
Back to tutorials On to Environmental models Covered in this section:
Parking model files
The following is a list of files used by the Parking Model. Only input files should be edited. The output files can be viewed in Excel. The model files Inputs should not be accessed in any way. The model files Outputs can be viewed if needed although this is not necessary as for normal use the output files will suffice.
Input Files Matrix.csv Matrix of trips from 4-stage model with irrelevant trips removed Building.csv File listing buildings of destination ParkingInventory.csv File listing all car parks with attributes DurationType.csv Duration types for car parks TariffType.csv Tariff types of car parks
Output Files Off Street Car Parks.xls Summary stats for off street car parks On Street Car Parks By Zone.xls Summary stats for on street car parks Pay Car Parks.xls Summary stats for pay and display car parks
Model Files - Inputs Parking.xls File pointing to input and output files Scenario.pdc Location file for this scenario CPPurposetype.csv Purpose types for car parks (not used) Ownership.csv Ownership types for car parks (not used) Perception.csv Perception types of car parks (not used) PbSkim.dat Highway skim file from highway assignment model Voldelayfuncs.csv Volume delay functions for car parks Deptimedistrib.csv Departure time distribution file Staydurationdistrib.csv Stay duration distribution file by arrival time
Model Files - Outputs ParkingTrips.csv File showing each individual tripi record after chosen car park Trips.csv File with one record for each trip before chosen car park sorted by car park arrival time UsagebyCarParkFile.csv Usage file grouped by car park index number UsagebyZoneFile.csv Usage file grouped by car park zone number UsageFile.csv Usage file PdModelLogfile.dat Log file from the model run showing the calculation used for each individual trip
Instructions for use
Before using the model you must ensure that all files are not read only.
Select Parking from the Models menu to show the following form
Create New Scenario tab
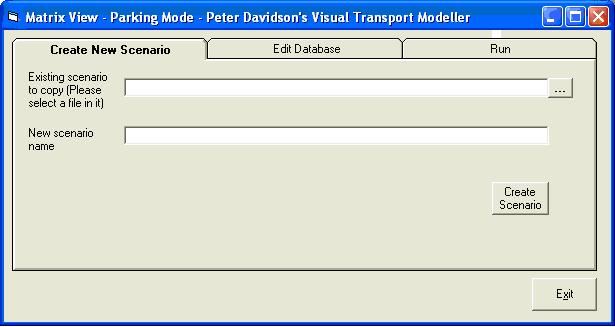
This should be used if a new parking model scenario is to be created
Click the browse button
and select the existing scenario to copy the input files from in the top box.
Type in the new scenario name in the bottom box as shown below.
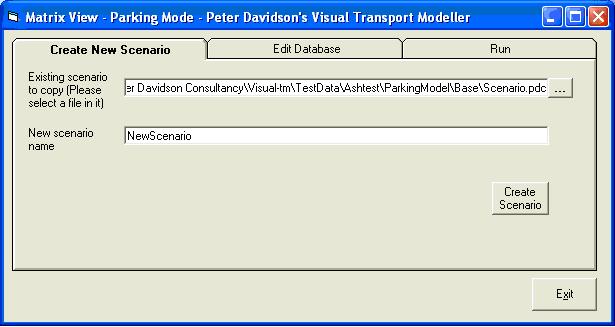
Then click Create Scenario
Visual-tm will now take a copy of the files in the existing scenario and create a new scenario. When its finished it will display the following form
Click Save and the following box will appear
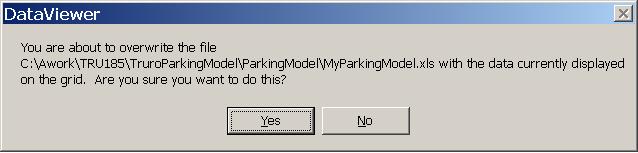
Click yes to save your new scenario.
Edit Database tab
All the input files can also be edited using a standard text editing package such as notepad or in Excel.
Once the new scenario has been created you will now want to modify some of the input files so as to create the description of the scenario. This is done on the Edit Database Tab shown below
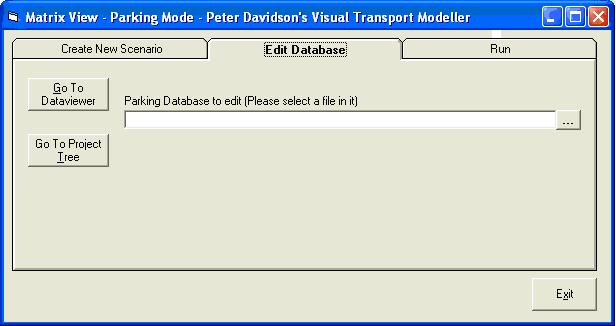
Click the browse button
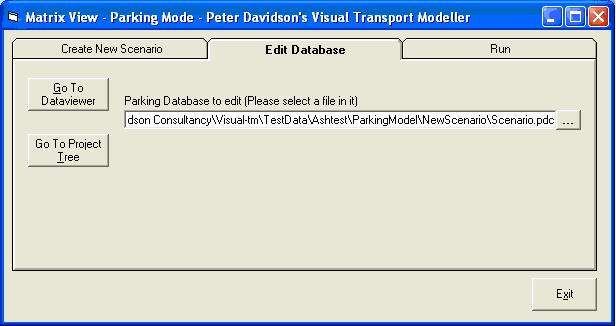
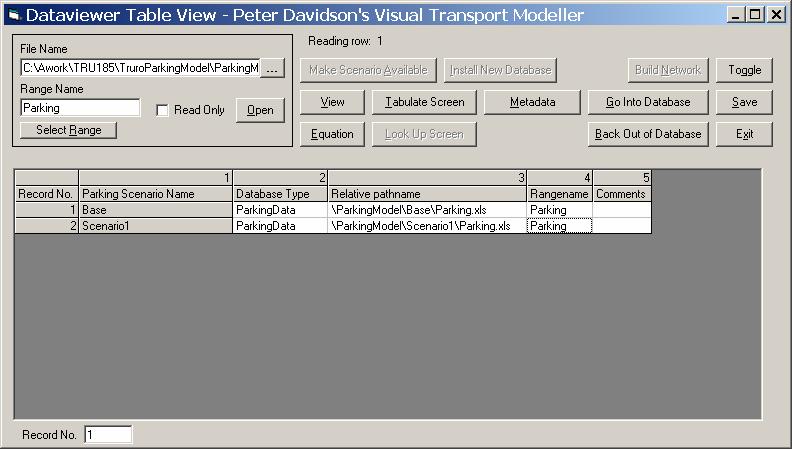
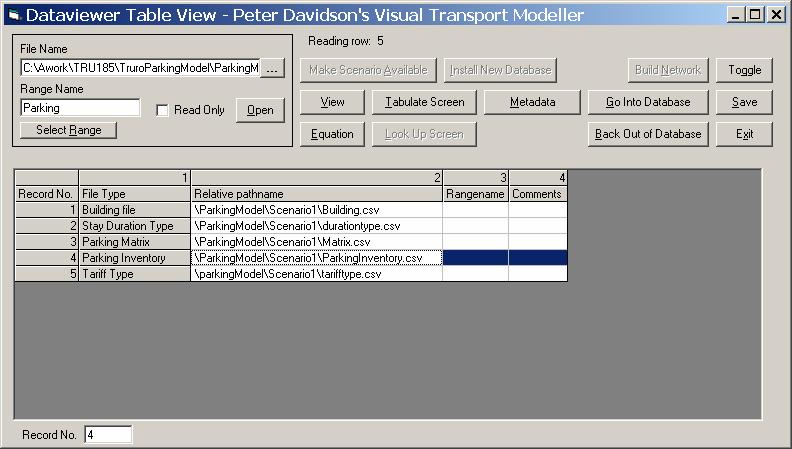
Then click Go To Dataviewer. The following form will appear.
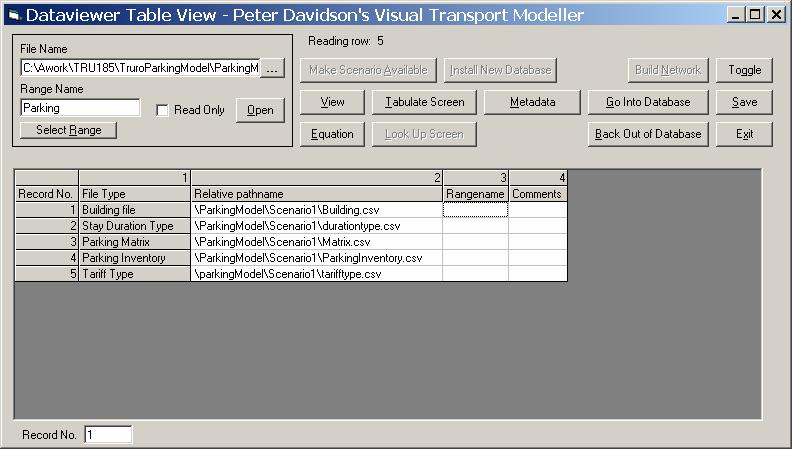
This is a list of the input and output files within this scenario. Select a file to modify. The example below shows a modification of the parking inventory.
Then click Go Into Database. The form below will appear.
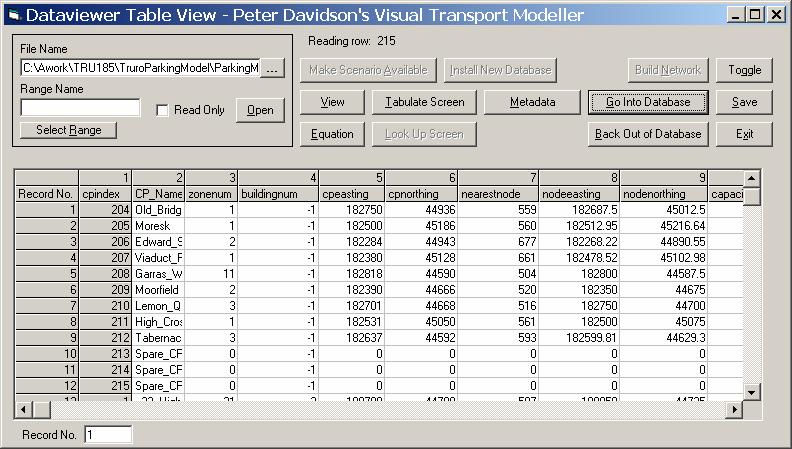
This is now a list of all the car parks in the parking inventory. This time select a car park to modify and Click View. The form below will appear
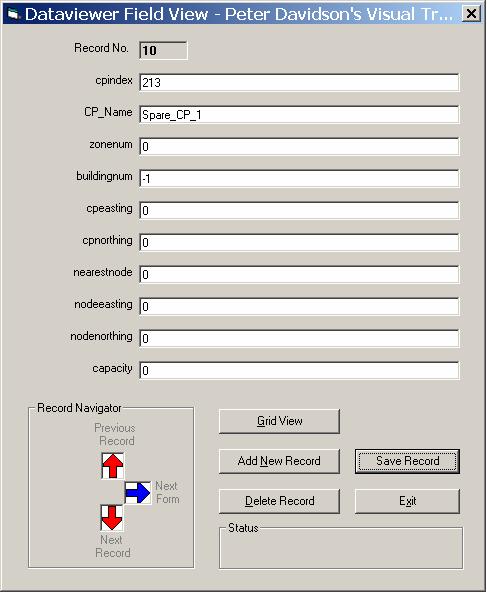
Modify the record as required then click Save Record. This takes you back to the Dataviewer form. Click Save and the following message appears.
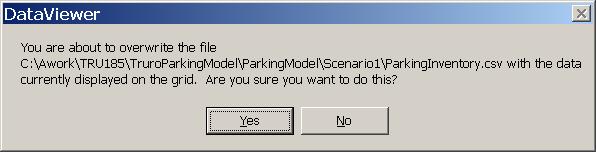
Click yes to save the file.
All the input files can also be edited using a standard text editing package such as notepad or in Excel.
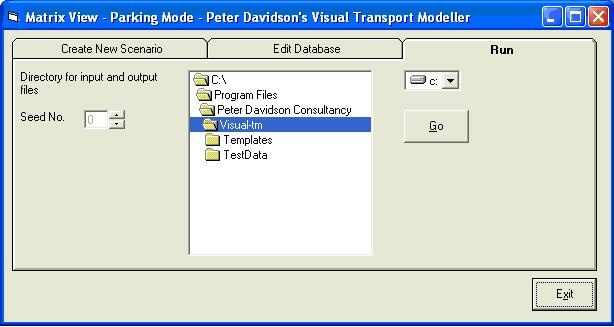
Run tab
This is where the parking model is run from. Simply browse to the directory in which the model run input files are stored as shown below.
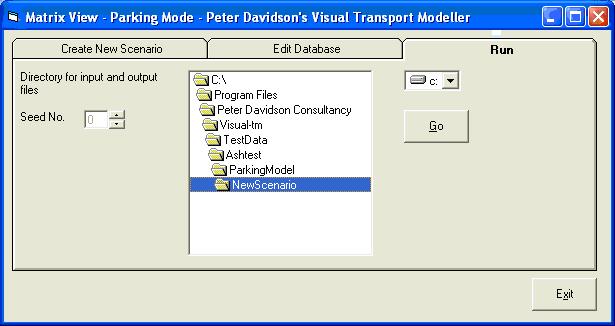
Then click Go.
The Seed No. box can be used to modify the random number generator in the box. We suggest that this is normally set to 1.
When the model has finished running a message saying Finished will appear on the form. Summary statistics of the run can be obtained by opening the summary statistics spreadsheets as defined above. A description of how to use these files is given below.
Output files
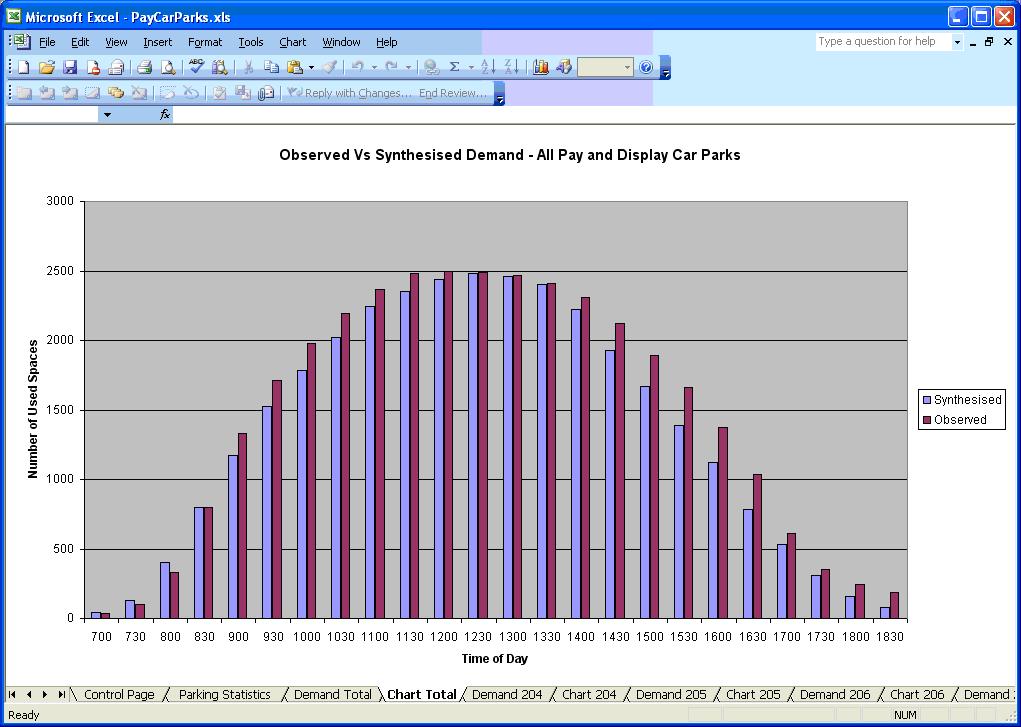
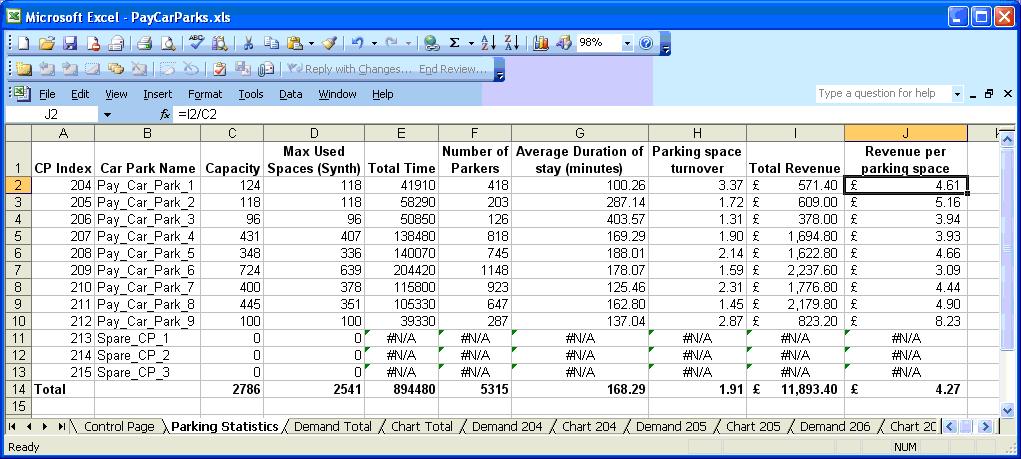
PayCarParks.xls
Control Page This sheet can be used to print out a usage graph for all individual car parks along with a total and the parking statistics. Simply click the grey buttons. A separate demand sheet and chart is provided in the spreadsheet for all the pay and display car parks.
Chart Total This is a chart showing the observed vs synthesised usage by time of day for all the pay and display car parks.
Parking Statistics This sheet has the headline parking statistics for this scenario run.
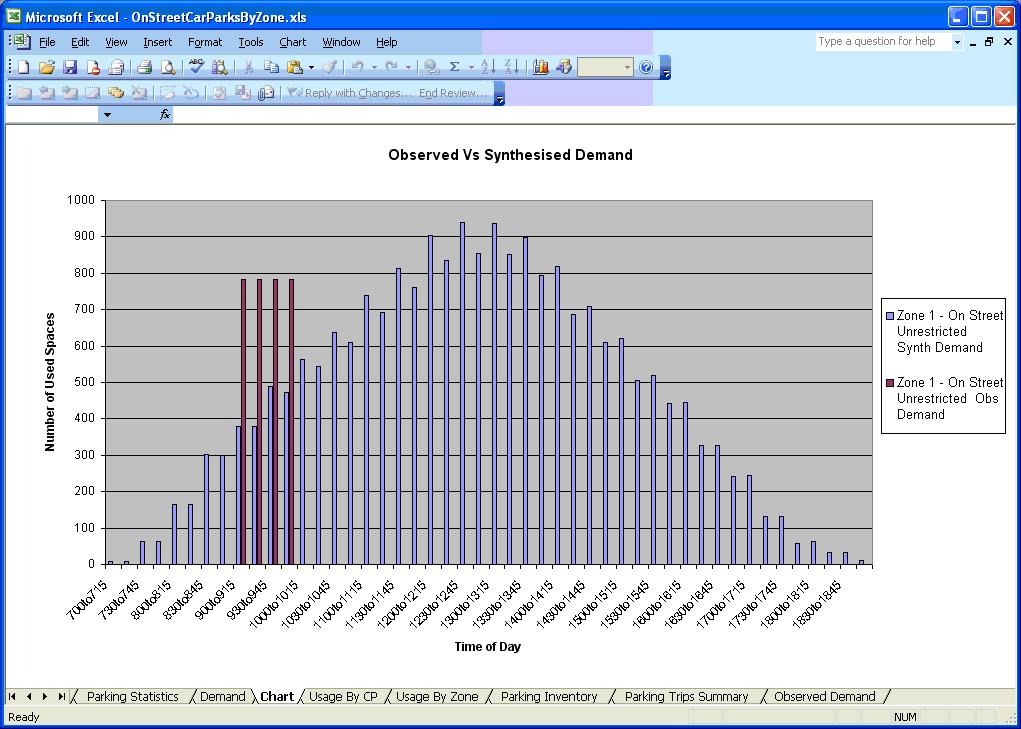
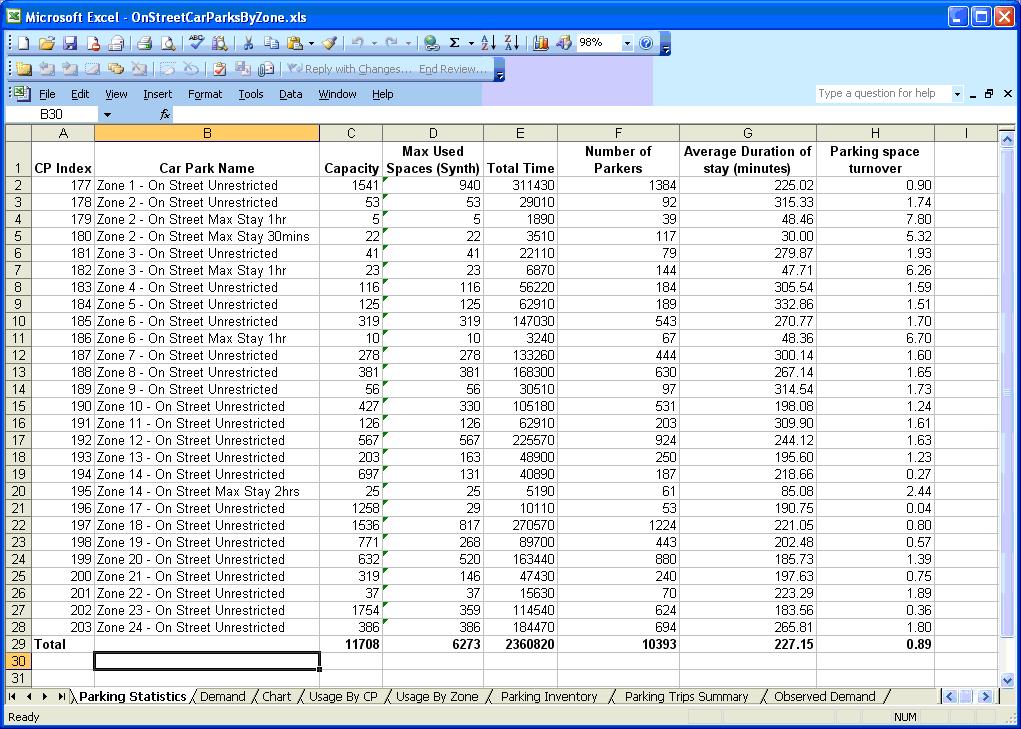
OnStreetCarParksByZone.xls
Control Page This sheet can be used to print out a usage graph for all individual car parks along with the parking statistics. Simply click the grey button. You can also use this sheet to produce a chart for individual car parks simply by typing in the CP Index number of the required car park in cell C2
Chart This is a chart showing the observed vs synthesised usage by time of day for the CP Index chosen on the control page.
Parking Statistics This sheet has the headline parking statistics for this scenario run.
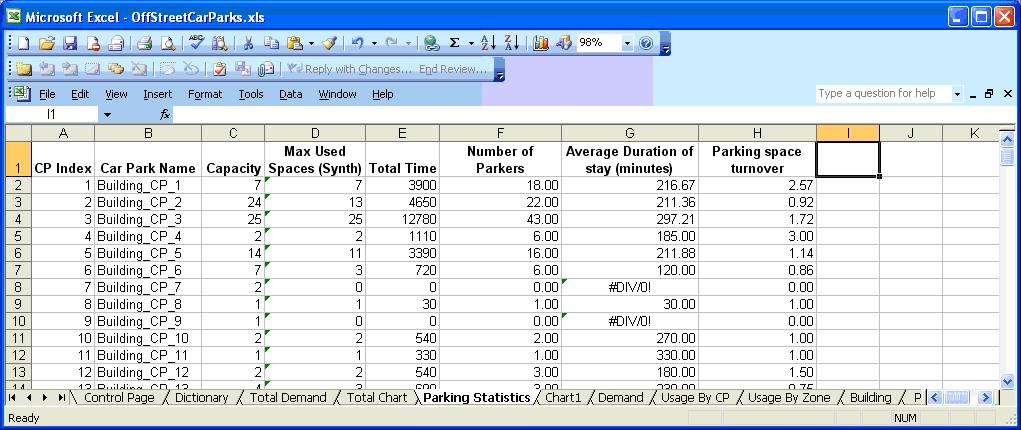
OffStreetCarParks.xls
Control Page You can use this sheet to produce a chart for individual car parks simply by typing in the CP Index number of the required car park in cell C2.. The required chart is displayed on sheet Chart 1
Total Chart This is a chart showing the observed vs synthesised usage by time of day for the CP Index chosen on the control page for all Off street free car parks.
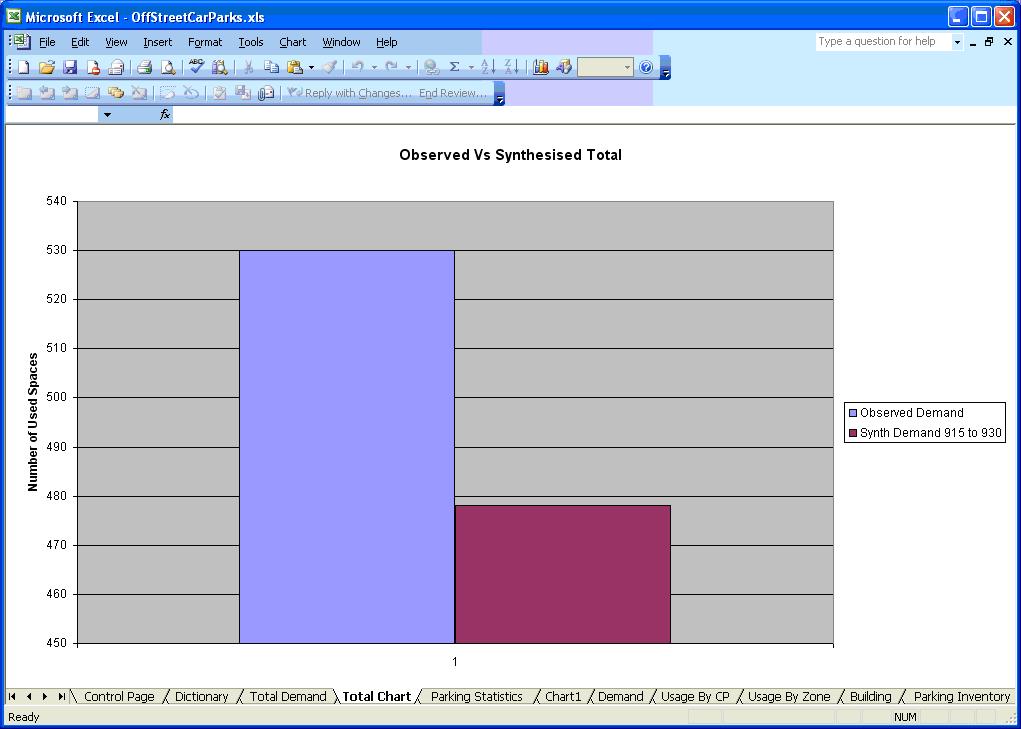
Parking Statistics This sheet has the headline parking statistics for this scenario run.
Back to tutorials On to Environmental models