![]()
![]()
![]()
![]()
![]()
![]()
![]()
![]()
Visual-tm: Accessibility Models
![]()
Back to tutorials On to four-stage models Obtaining Accessibility Results
Once the network file has all the data in it that is necessary for producing a skim, a project should be opened that uses this network and a Standard Set of Skims produced from it in the normal way as described in chapter 18. This skim file is one of the main inputs for the accessibility model run.
Accessibility results are obtained on the Zone Accessibility from Skim tab. The skim file is selected as the first input and the Excel file containing the zone data is selected as the Output Area file. The data can be at ward level or any other zone system, but the data in the file needs to conform to the zones in the network and the skim. The range with the data is chosen and then the columns with the zone numbers and the population or number of households in the zones.
The OA Destinations of Interest file lists the zone numbers to which the accessibility is required e.g. every zone that contains a school. The zone numbers should be in a range with a single column or in the first column of a range that has multiple columns. An output file name should be entered and a Threshold time entered, which is in minutes. If the travelling time from a zone to any of the Destinations of Interest zones is below this threshold, then the population or households within the zone are deemed to meet the accessibility conditions.
The travelling time can either be the In Vehicle Time or the sum of IVT, waiting time and walking time. For this option, tick the Use Total Time tick box.
A typical example is shown below:
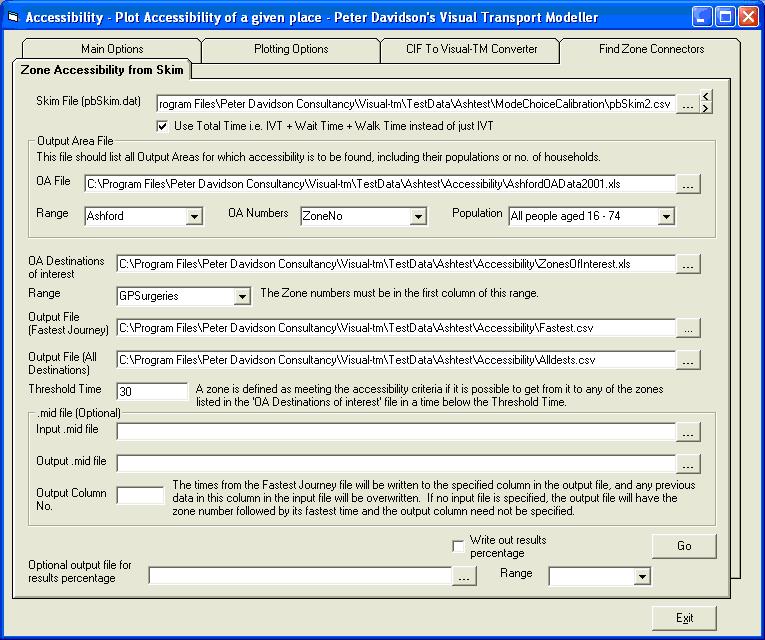
Click Go to perform the calculation. The percentage of households or population that meet the accessibility condition will be displayed on the bottom of the form at the end. There are two output files. The one labelled 'Fastest Journey' is a Comma Separated Variable file that lists each zone number followed by its population and then the minimum time to get from it to one of the Destinations of Interest. If a zone has a value of a million in this field, it means that the path building was unable to find a route from that zone through the network to any of the destinations of interest. The output file labelled 'All Destinations' gives the journey time from each zone to every destination of interest. Again, a value of a million means that the journey cannot be made through the network.
The skim file is only read in when it has just been selected, so to change the skim file browse to it and select it. Replacing the existing file will not cause it to be read in unless it is reselected using the browse button.
There is an option for writing the minimum time values from the Fastest Journey file into a specified column in a MapInfo .mid file, which may be useful for display purposes. To do this, select the .mid file in the Input .mid file text box and put an output file name in the Output .mid file text box. Put the column number of the field you wish to write the values into in the Output Column No. text box. You may overwrite any of the existing fields or enter a value that is one greater than the existing number of fields, in which case a new field will be added on to the end of each record.
There is an also an option for writing the percentage of households or population that meet the accessibility condition into a spreadsheet. This may be useful if running a macro that performs a sequence of Accessibility calculations. To do this, tick the Write out results percentage tick box at the bottom of the form, browse to the spreadsheet and then select the required range in the drop down box. The range must have at least two rows (the first is reserved for headings) and the percentage value will be written to the first cell on the second row.
Back to tutorials On to four-stage models