visual transport modeller: checking paths
![]()
Back to networks On to matrix manipulation In order to check the shortest path you can go to 'method' and click on the option saying 'shortest path'. You are then able to find the shortest path between two nodes by clicking on origin node followed by the destination node. A small window will then appear asking how many paths per origin-destination pair you would like. Enter 1 here and click OK if you only want one. This method will not be valid if the values of general cost in Road.xls are set to zero, as it can then pick any route.
If you wish to find a node that is unlabelled you can go to ‘view’ and then click on ‘find node’. This will highlight the node you are looking for however you may need to zoom out if it is outside your current screen shot. A similar operation can be performed to find where a particular link is situated on the map by going into ‘view’ and then clicking on ‘find link’. Here you need to fill in the window with the node you are starting with and press ok and then fill in the name of the node that you are going to. The two nodes of the link will then be highlighted on the map.
This will give you the shortest path that the software feels is correct, on the map. This is not always correct if the software has not been updated. It does however give a good indication of the shortest path between the two nodes.
In order to check that the paths are correct and look like they make sense visually through the software, you can create a new matrix which when assigned shows the route to/from any origin or destination node. This will enable you to check both that the route looks sensible and compare them to other routes to see if they always take the same path between certain zones and nodes. In order to create these matrices you must go into the software and click on 'matrix', 'file' and then click on 'New Matrix'. Here you name the new matrix as appropriate, choose '.bmt' file and where it says select type it is a Binary Erica-Trips file. Fill the number of zones with the number of zones that you have in your model and set the cell value to zero.

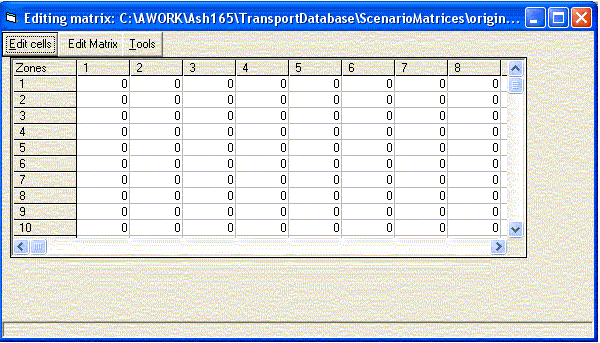
You will be presented with a zero value matrix and this needs to be edited in order to do the checks on the nodes you require. By clicking on the zone number either on the column (representing outward going journeys from this zone) or the row (representing incoming journeys to this zone number) you can then edit the cells and fill the row/column with values of flow.

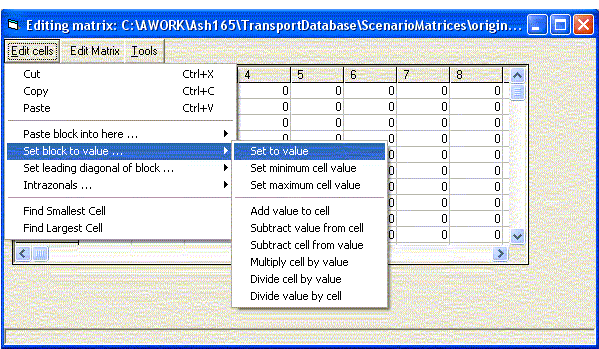
You can do this as shown in the diagram and by clicking on 'set to value' you can then set the value of the cells in the row/column to 100 (it needs to be a value that is large enough to view when the assignment is run so 100 is about right). You then need to save this matrix. To do this you need to go back to the original window and clicking 'matrix', 'Save As'. Here you save it as a Binary Erica-trips file and the Market segment is whatever market segment you wish to check (1 normally). You can then assign this matrix and see what the routes look like. To check that the paths are correct you can create some outward and return matrices for both the same and different matrices to compare with these paths. They should take a sensibly similar value to other paths and the same routes between certain nodes.
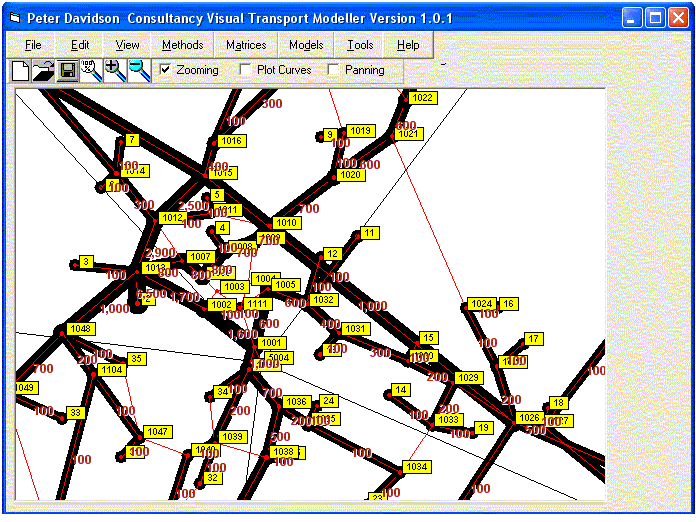
The view flows' function will plot traffic flows from the matrix you have created to the Visual-tm software and display the route that this traffic takes through the network of the area. It will take the value of the segment of the matrix and make this value a flow on the map. You can also view the flows, speeds and general costs of the links in the file 'Assignment.xls'.
Now on the map there should be 100 trips going to/from the selected zone to its all of the other available destination zones. If the trips look like they are taking sensible routes and are going the same way for the return as the outward (unless there are one-way systems, mode penalties, etc) then the check is complete. In order to make a complete and more detailed check of the routes you can check the outward and return journeys from five different zones preferably all in different sectors. From this data you can also check the difference in the general cost between two links and change the general cost in Road.xls to ensure that the difference is valid for the two links. If a link looks wrong you can look up the general cost in assignment.xls and compare the general cost to the one you think it should be. You can then change the general cost in road.xls to view the differences and check that the routes look right with the added and subtracted general costs.

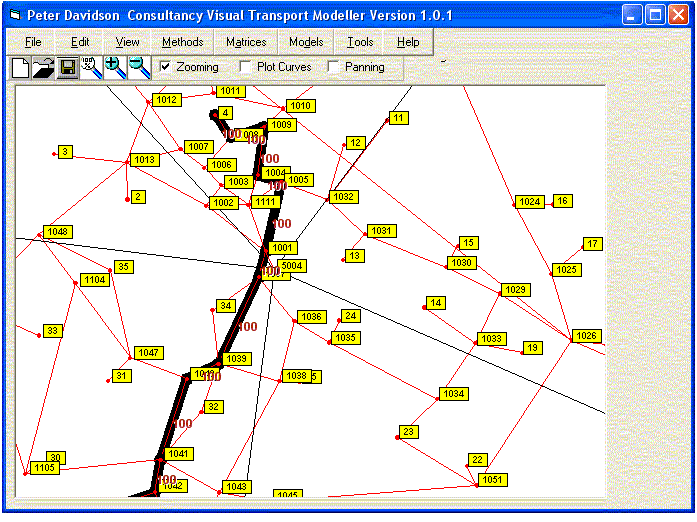
Before the checks were to make sure the paths to/from a node to every other zone in the network were valid, but you can just check a single path by doing the following: To simply check the route that a path takes between two zones you can run a select path assignment. To do this need to create a new matrix filled with zeros and select only the cell representing the link between the two zones that you are interested in checking (i.e. 9,3). This cell needs to then be filled with a set value of 100 for example and the new matrix needs to then be assigned as before. You can then view the path it has taken and compare it with other routes and the return journey (i.e. 3,9). This will only give you the path between the two zones on the map and is easier to see than before. It will be the path that the traffic will take when there is no other traffic interfering with its flow.
If you plot an assignment with this new matrix it will show the route and its flow like the following:

Back to networks On to matrix manipulation