![]()
![]()
![]()
![]()
![]()
![]()
![]()
![]()
Visual-tm: Distribution Models
![]()
Back to tutorials On to accessibility models Covered in this section:
- What is distribution modelling?
- Input files explained
- Growth factor method
- Furness method
- Gravity model calibration
- Gravity model forecasting
- The log file
- Model outputs
What is distribution modelling?
A distribution model produces a new origin-destination trip matrix to reflect new trips in the future made by population, employment and other demographic changes so as to reflect changes in people's choice of destination. They are used to forecast the origin-destination pattern of travel into the future and produce a trip matrix which can be assigned in an assignment model of put into a mode choice model. The trip matrix can change as a result of improvements in the transport system or as a result of new developments, shops, offices etc and the distribution model seeks to model these effects so as to produce a new trip matrix for the future travel situation.
Input files explained
Input matrix
This is the observed base year trip matrix.Target trip ends
This file is required for Furnessing and gravity model forecasting, but not calibration. It contains the tripends for the forecast year.Base year logsums
This file contains the logsums for the base year. A logsum is a measure of the closeness of the origin and the destination of the trip. See the Mode Choice Models chapter for a more detailed explanation and the method of producing logsums in Visual-tm.Future year logsums
This file contains the logsums for the forecast year.Switch matrix
The Switch Matrix specifies which model type is to be used for each O-D cell during the run.A value of 1 means that the Furness model will be used for the cell. A value of 2 means that the absolute doubly constrained gravity model will be used for the cell and a value of 3 means that the incremental doubly constrained gravity model will be used for the cell. Any zero or positive value applies a multiplicative factor of that value. Any value less than 3 is treated as zero.
During calibration runs, a value of 3 will be treated as 2 and a value of 1 will cause the cell to be ignored. The cell is treated as zero if zero or any positive number is present.
Indicator matrix
The indicator matrix specifies which value of beta is to be used for each O-D cell during the run.In the coefficient file each beta value is given an index number. This index number then appears in the indicator matrix for each O-D cell that is to use this value.
Cells to calibrate over
For a calibration run, this acts as an indicator matrix which specifies which cells to calibrate beta over.For a forecast run if the Cells to Calibrate over file contains a value other than zero for a cell, it will forecast that cell.
Coefficients
The coefficient file has a standard header, followed by the number of zones (66), number of coefficients (1) and number of market segments (1). There then follows a list of the coefficients in the form index number, alpha value, beta value.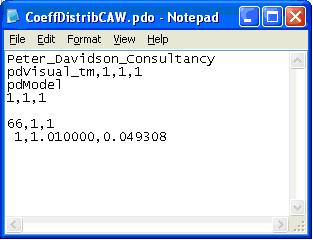
For a calibration run an input coefficient file is needed and the output coefficient file contains the calibrated beta values.
For a forecast run the input coefficient file is an output coefficient file from a previous calibration run.
Growth factor method
The Growth Factor Method is simply the scaling up of elements in a matrix by a growth factor. The form to do this is accessed by selecting Matrices/Matrix Calculations/Squeeze/Expand. Choose the Apply sector growth factors to zonal matrix button to display the form below:
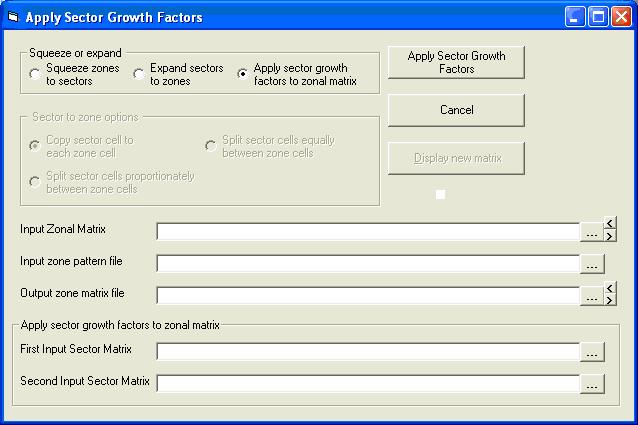
The two sector matrices are entered in the sector matrix text boxes. The resulting output is the input zonal matrix with each cell multiplied by the appropriate sector cell from the first input sector matrix and divided by the appropriate sector cell from the second input sector matrix.
Furness method
Visual-tm provides the capability for Furnessing matrices that are in comma separated variable or O-D Cell format. Samples of the files required to undertake a Furnessing procedure have been supplied with the test data.
Click Models/Distribution/Gravity Model to display the Distribution form.
Furnessing a CSV matrix
Click the Furness button on the distribution form: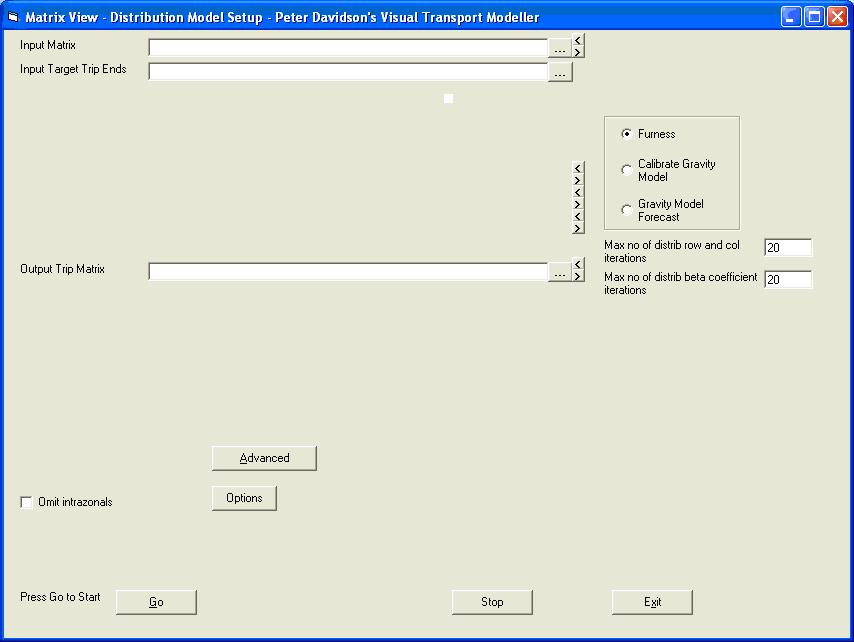
The input matrix is called InputMx.csv stored in TestData\PdEdit\Furnessing. Click
to browse, select the file and click Open.
The input target trip ends file is called TeInput.csv stored in the same location as the input matrix. Click
You can select an Output matrix and the form should now look like this:
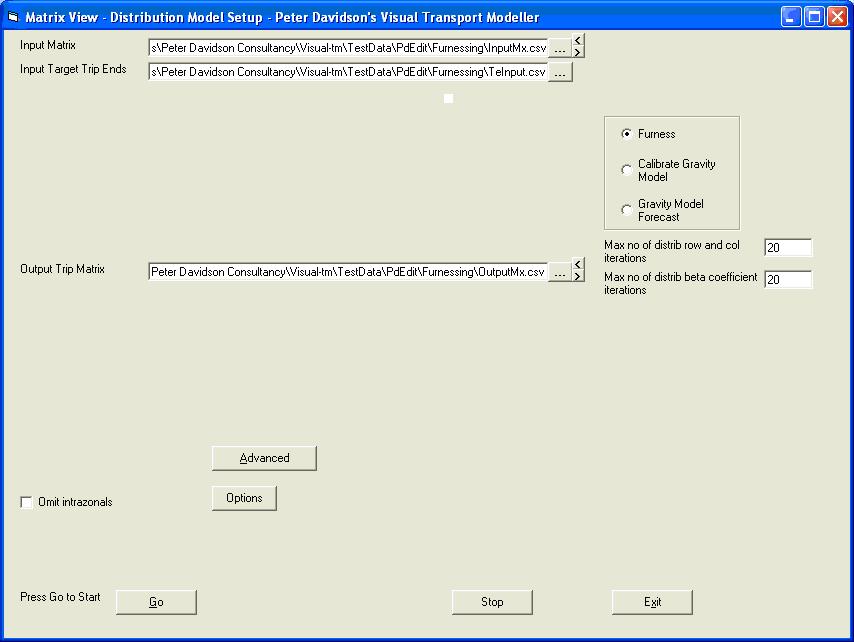
Click Go to run the Furness.
Once the Furness has been completed you need to close the form and open the output matrix to view the results of the Furness procedure.
Furnessing an O-D Cell Text File
The process for this is exactly the same as for a comma separated variable file except the input and output matrices are in O-D cell text format with a file extension of .txt. An input matrix TestData\PdEdit\Furnessing\Jbo.txt has been supplied with the test data. The tripends file needs to be in the same format as that for Furnessing a CSV matrix.Gravity model calibration
To calibrate the gravity model, open the Distribution form and click the Calibrate Gravity Model button if it is not already selected:
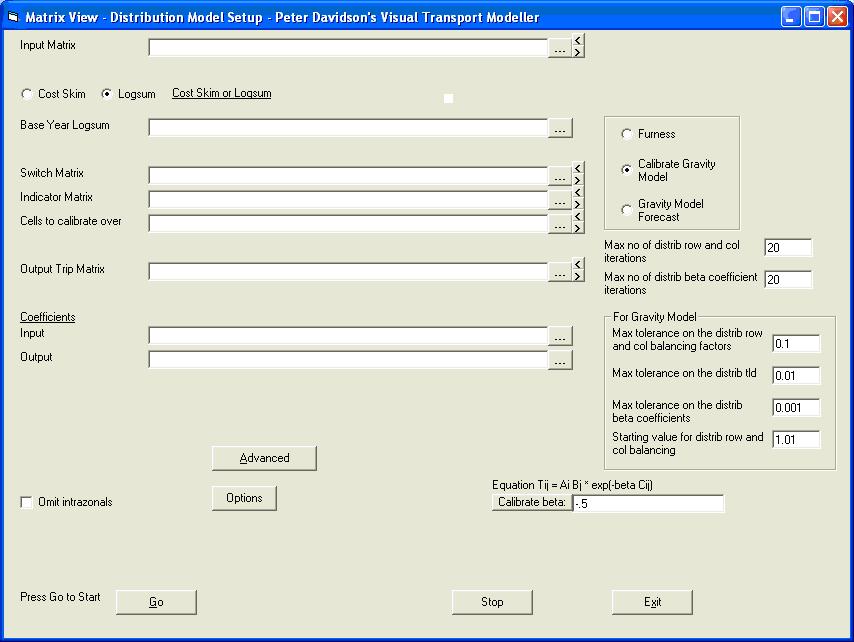
Of the eight files for the calibration run, the first five and the seventh are required inputs and the remainder are required outputs. All files except the coefficient files must be in comma separated variable format. Put the required eight file names in the text boxes and click Go to do the Calibration run.
Gravity model forecasting
Having done the calibration run, the Output Coefficients file is put in to the forecast run as the Input Coefficients. Choose the Gravity Model Forecast option and the Future Year Cost Skim text box becomes available. For the forecast run, a Base Year Cost Skim is not used, except for the Incremental Gravity Model. The rest of the first files are required inputs, as is the Input Coefficients file. The Output Trip Matrix is the only required output file. Click Go to do the forecast run.
The log file
When a distribution model is run a log file is produced. It can be found in the projects System\Working directory and is called pdModelLogDistrib.dat.
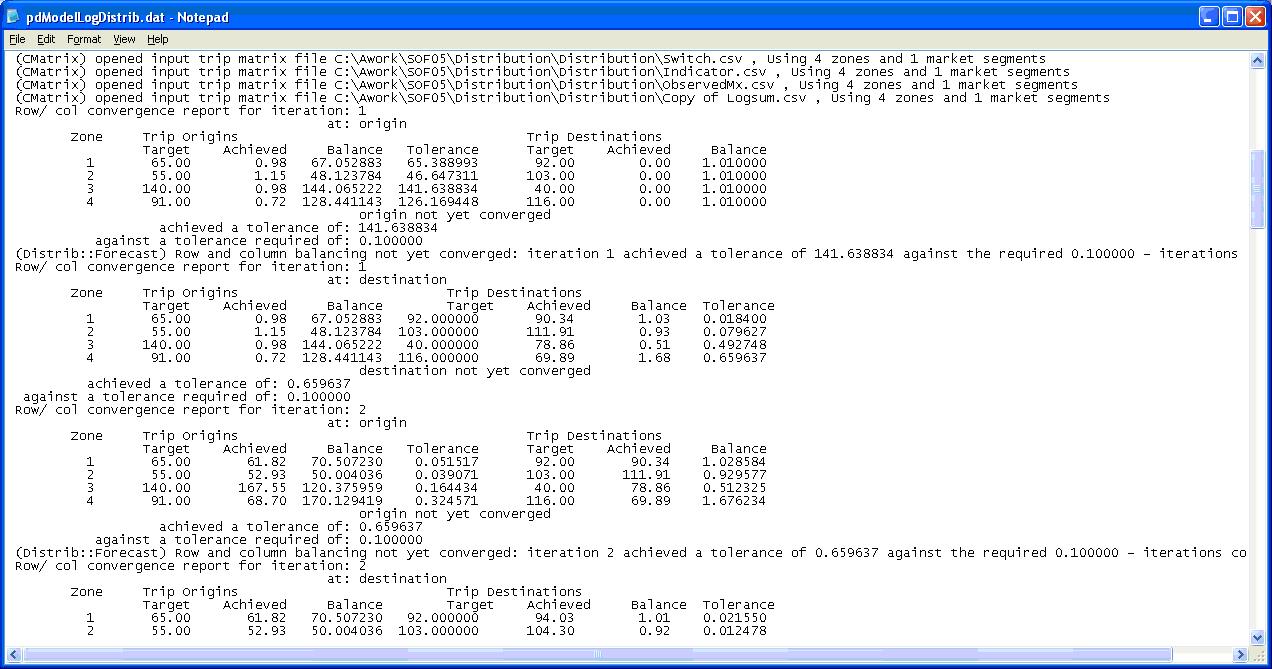
It contains a report of the target and achieved tripends for each iteration.
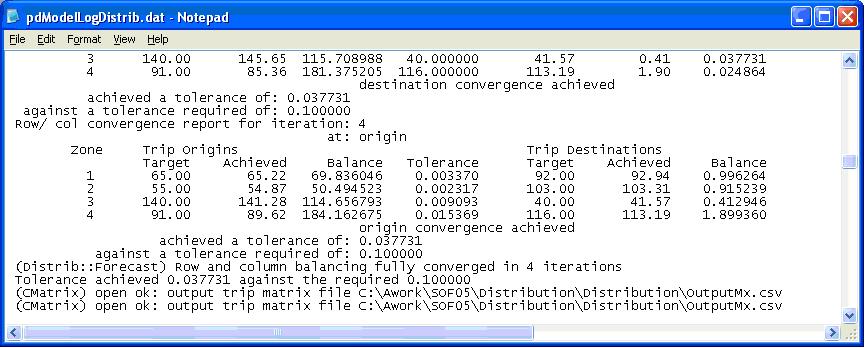
After this data it reports Row and column balancing fully converged in x iterations. It is important to check this as it will be reported here if the model fails to converge.
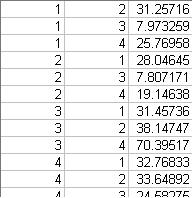
Model outputs
The output matrix contains the number of forecast trips for each origin-destination pair:
Back to tutorials On to accessibility models