![]()
![]()
![]()
![]()
![]()
![]()
![]()
![]()
Back to tutorials On to matrix building Covered in this section:
- Different matrix formats
- Opening an existing matrix
- Creating a new matrix
- Modifying matrices
- Matrix calculations
- Matrix conversion
- Tripends files
- Distance matrices
- Trip length distribution
- Census Matrix Tools
- Large matrices
Different matrix formats
Visual-tm provides the functionality for viewing and editing matrices. It enables the user to view matrices derived through many of the main transport software proprietary suites, including Saturn, Trips, Qview, Minitramp and Emme/2.
A sample matrix for each of these suites has been included in the test data. They can be found in the PdEdit folder.
The main type of matrix used by Visual-tm is a comma separated variable file, which should have a file extension of .csv. Another type that can be used is called a Binary ERICA Trip matrix, which has a file extension of .bmt. These are the type of matrix required to utilise many of the advanced features of Visual-tm.
Opening an existing matrix
There are two ways of opening an existing matrix in Visual-tm.
Opening a matrix from the menu bar
To open an existing matrix click View/New/View Existing Matrix. The Open Matrix form appears: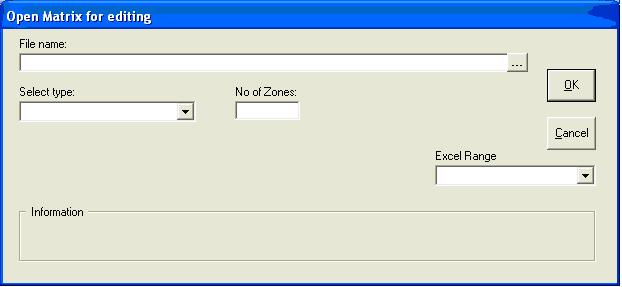
Browse to the matrix file you want to open and then select its format from the drop down menu.
The other boxes on the form will change depending on the format of the matrix being opened. If it is a binary ERICA matrix you will be asked for the market segment and number of decimals to view. If it is a comma separated variable matrix you will also be asked for the number of zones.
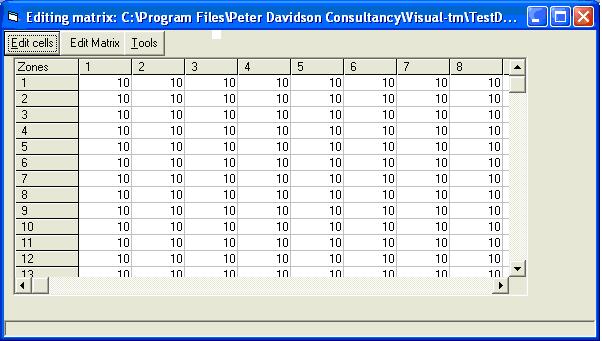
When the form is filled in correctly, click OK and the matrix will be displayed on a grid:
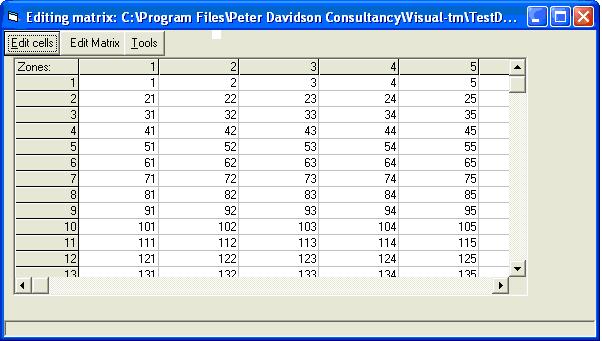
The zone numbers down the left hand side are the origin zones and the ones across the top are the destination zones. For example, in the matrix shown above there are 23 trips going from origin zone 2 to destination zone 3.
Opening other matrix types
Visual-tm can open many different types of matrix. Further notes on some of these formats follow.Visual-tm can open two different types of O-D cell matrix. The O-D Cell option is for files that have only the origin zone, destination zone and number of trips in each record. The EMME2 O-D Cell option is for opening the text files used by the EMME2 program. These have a colon between the destination zone and the number of trips and not a space. It is important to select the correct option when opening an O-D cell matrix. The EMME2 files must have only one O-D pair per row if the EMME2 O-D Cell option is chosen. If there are three cells per row the EMME2 3 Zone option must be chosen to read the matrix. If there are four cells per row the EMME2 4 Zone option must be chosen. If there are five cells per row the EMME2 5 Zone option must be chosen.
Binary ERICA Matrices can contain as many as three values per record that may be of interest. These are the number of trips, the variance associated with it and a third value called records. This is the number of trip records from which the Trips value was derived i.e. before whatever data processing and grossing up resulted in the Trips value. Selection of Binary ERICA Trips, Variances or Records determines which values are displayed.
Printed ERICA Matrices display all the values in the binary ERICA file. They have one O-D pair value per row, which is duplicated for each Market Segment. The first field is the Market Segment, followed by the origin zone and then the destination zone. The following two fields normally contain just ones and are of no significance. The final three columns are the Records, Trips and Variances.
Printed CMT Matrices are the text ERICA matrices produced from binary ERICA matrices by the Census Matrix Tools program. They are the same as the ERICA text matrices described above except that they omit the two redundant columns with ones in. The correct option must be chosen when opening one of these two file types. The Matrix Editor will not create Printed CMT Matrices, as Printed ERICA Matrix is the normal format. A message recommending Printed ERICA Matrix will appear if an attempt is made to save a matrix in Printed CMT format.
Opening a matrix from the Dataviewer
If the matrix database has been set up correctly, matrices can be opened from the Dataviewer. To access the Dataviewer, select Database from the View menu. Select a cell in the Matrix Data row and click Go Into Database. A list of matrices in the database is displayed: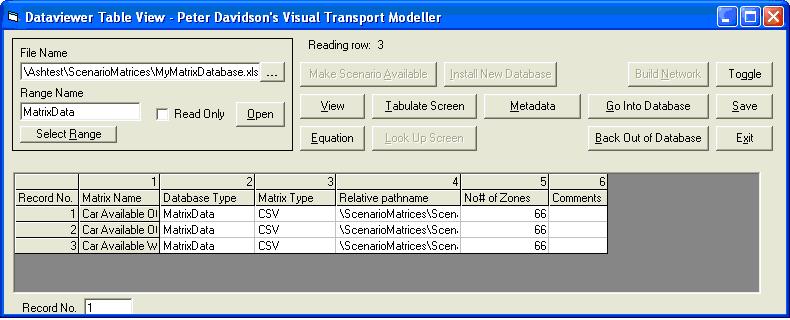
To open one of these matrices simply click on one of the cells in its row and click Go Into Database. The selected matrix will then be opened on the grid as described above.
Creating a new matrix
To create a new matrix click View/New/Matrix. The Create New Matrix form appears:
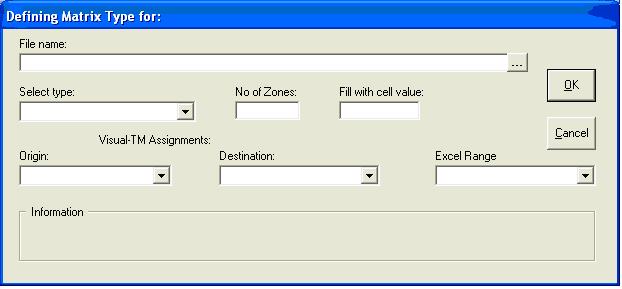
Browse to the location where you want your matrix file to be created and give it a name. Then select its format from the drop down menu.
The other boxes on the form will change depending on the format of the matrix being created. If it is a binary ERICA matrix you will be asked for the number of zones and the value to fill the cells with. If it is a comma separated variable matrix you will also be asked for the market segment number.
The number entered in the Fill with cell value box will be the number in every cell of the matrix when it is created. As an alternative the Fill with cell value box can be left blank, in which case each cell is left empty and values can be input via the editor separately.
When the form is filled in correctly, click OK and the matrix will be displayed on the grid:
Note that at this point the matrix has only been created on the grid the file has not yet been saved to your computer. To save it use the Save As option on the File menu.
Modifying matrices
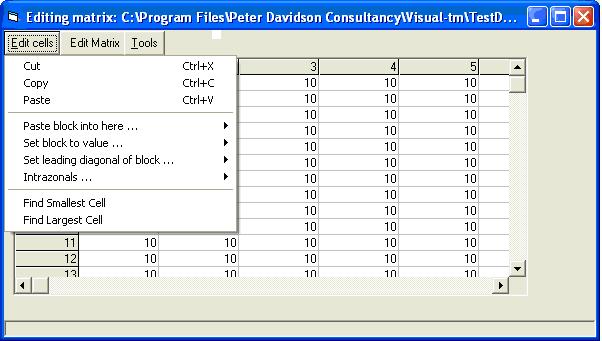
When a matrix is displayed on the grid cells can be selected by clicking on them. Blocks of cells can be selected by clicking the cell in the top left corner of the block and dragging the cursor down to the bottom right corner. There are various operations that can be performed on a selected cell or block of cells, which are displayed by clicking the Edit cells button:
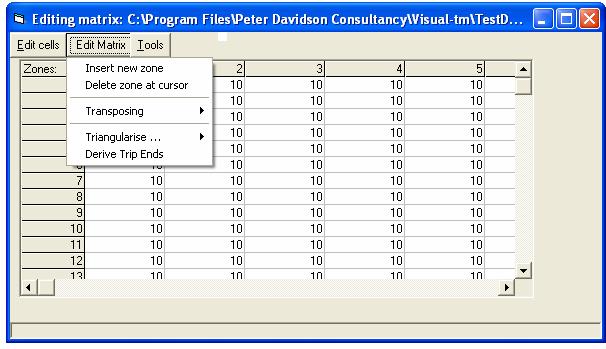
Operations may also be performed on the whole matrix, such as inserting or deleting zones, transposing and triangularising. These options are displayed by clicking the Edit Matrix button:
Matrix calculations
The Matrix Calculations option on the Matrix menu calls up a sub menu that allows various operations to be performed on binary ERICA or CSV matrices. The Matrix Calculations item at the top of the sub menu allows a new matrix to be produced that is the result of an arithmetic operation carried out on one or two other matrices. The matrices must be in either Binary ERICA format or comma separated variable format.
Binary ERICA Matrices
The Matrix Calculations screen has text boxes for entering the names of the input matrix or matrices, the market segment numbers required, numbers which the cell contents are to be multiplied by and a drop down list box from which the user chooses the required arithmetic operator. For example, to produce an output matrix called MatrixC.bmt with market segment 2 consisting of the contents of Market Segment 1 of MatrixA.bmt plus four times the contents of Market Segment 3 of MatrixB.bmt, enter the name MatrixC.bmt in the Output Matrix text box and set its market segment value to 2. Use the browse button to set the Input Matrix to MatrixA.bmt and enter 1 in its market segment box. Similarly, set the second input matrix to MatrixB.bmt and enter 3 in its market segment box and 4 in its Factor box. Choose + from the drop down list box. The form should now be set up as follows: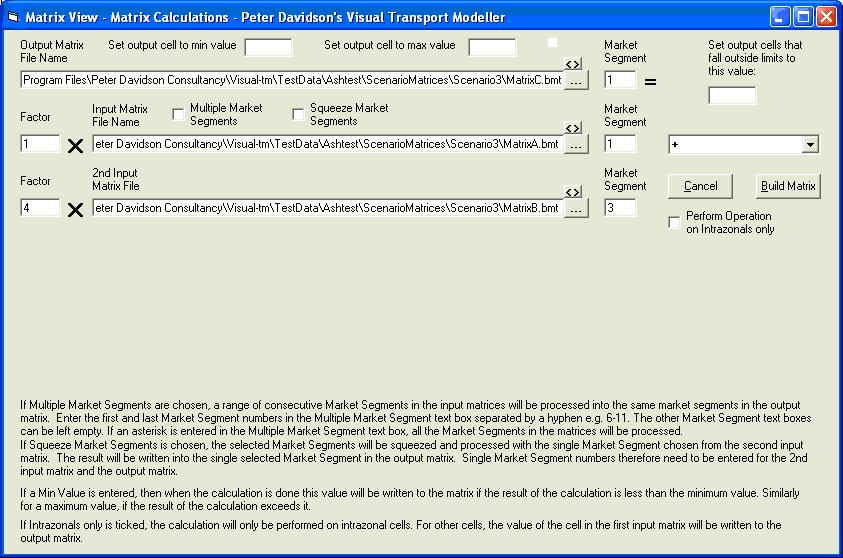
Click on Build Matrix to create the output matrix.
An output matrix that is just an integer multiple of a single input matrix may be created by setting the Output Matrix name and market segment, the Input Matrix name and market segment and the factor by which the Input Matrix is to be multiplied. Do not choose any of the operators in the list box or enter anything for the second Input matrix.
Note that there are also options for setting the result of the calculation to a minimum or maximum value. It is also possible to perform the operation on the intrazonal cells only by ticking the check box. The value of an output cell that lies above the maximum or below the minimum can be set to some value other than the maximum or minimum by entering the required value in the text box on the right hand side of the form.
Ticking the Multiple Market Segments check box allows a range of market segments in the input matrices to be processed into the equivalent market segments in the output matrix.
Matrix merging
Matrix merging allows different data sets covering the same area to be merged to produce an average of the number of trips between each origin and destination in the study area. Averages can be weighted according to the accuracy of the observed movements using their variances. Matrix merging is found by selecting Merge Matrices on the Matrix Calculations menu. All the matrices must be in binary ERICA format.As some datasets may give much better coverage in some areas than in others, the matrices to be used to give the merged result in each sector-to-sector movement are specified. A secpat file of the usual Comma Separated Variable format is therefore opened first when setting up the matrix merging. Browse to the file and then click the Read Secpat File button. The Sector to Sector Movements list will display all possible sector to sector movements.
The matrices to be merged are added to the Input Survey Matrices list by using the browse button to the right of it. A factor is requested for each matrix that is selected. A matrix chosen by mistake can be removed by selecting it and using the Delete Matrix button.
After selecting the matrices they now need to be linked to the sector-to-sector movements. Click on one of the sector-to-sector movements, then on the first of the matrices that is to be used for it and then click the Select button. The number of the sector-to-sector movement and the name of the matrix will be written to the list headed Surveys used in Sector-to-Sector Movements. Then select the rest of the matrices that are to be used for this movement. Repeat for all of the other sector-to-sector movements that are to be included in the merged matrix. If a matrix is linked to a movement by mistake, remove the item from the list by using the Delete button.
Choose a merging option from the drop down box. These are Maximum or Minimum, which will write the largest or smallest value found in the input matrices for each O-D zone pair to the merged matrix, straight average or weighted average. Enter a name for the output merged matrix and click Build to produce the matrix.
The matrices chosen or a sector-to-sector movement A to B are very likely to be the ones wanted for the reverse direction. If this is the case for all sector-to-sector movements, it is only necessary to select matrices for half of them. Click the Symmetry tick box and the other half will use the same choice of matrices as the reverse direction.
As it may take a long time to set up the form, all the settings on it can be saved for future reloading. Enter a file name in the Settings text box and click Save. To reload the settings, browse to the file and click Open.
Squeezing or Expanding a Matrix
A matrix may be squeezed by zone if it is in Binary ERICA or Comma Separated Variable format. To do this, choose Matrix Calculations on the Matrices menu and then select Squeeze/Expand. This displays the squeezing form: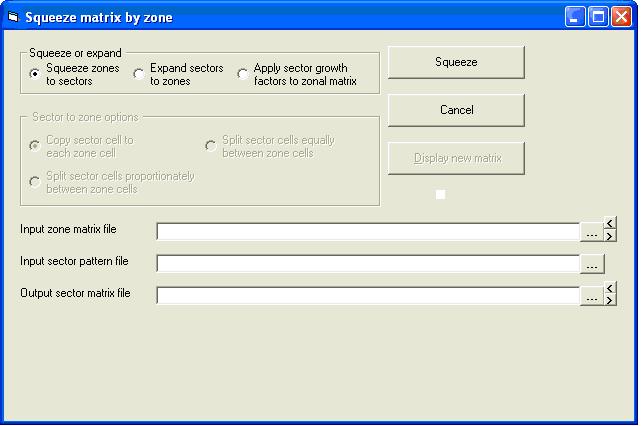
The matrix to be squeezed is entered in the Input Zone Matrix File text box and the output matrix is entered in the Output Sector Matrix File text box. The squeezing pattern file is entered in the Input Sector Pattern File text box and is a Comma Separated Variable secpat file in the usual format i.e.
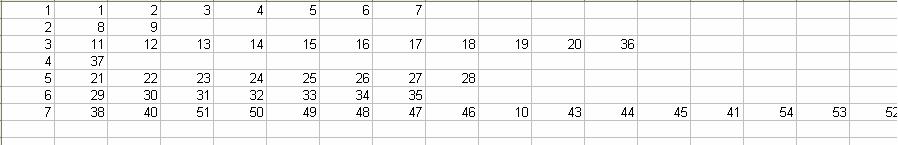
Where the first field is the sector number and the subsequent fields are the zone numbers to squeeze to that sector. There is an example in the test data under Eric_Database\ParameterFiles.
The secpat file can also be in a fixed width format where the sector number is in columns 1 to 5 and the zone numbers start in column 20. The file format can only be used on this form and not anywhere else in Visual-tm. There are examples in Eric_Database\ParameterFiles that have the extension .par.
Click the Squeeze button to produce the output sector level matrix. If the matrix is CSV, the number of zones must be entered on the General tab of the Model Options form
A matrix can be expanded from Sector to Sector level to Zone to Zone level by choosing the Expand sectors to zones option. This changes the appearance of the form as follows:
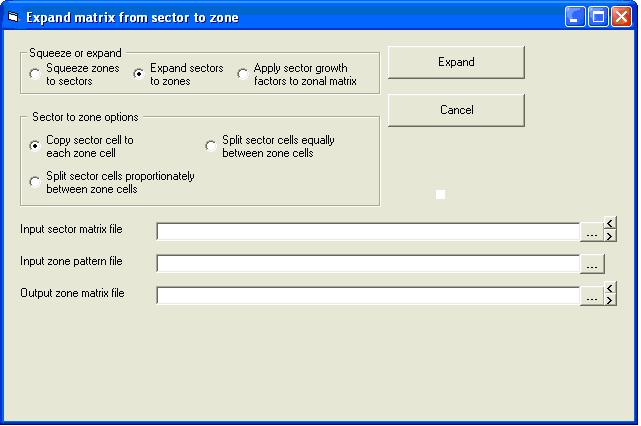
The sectors in the input matrix will be expanded to zones. The number in the input sector will be written to every output zone if the Copy sector cell to each zone cell option is chosen this could be used for sector constants like fares or surcharges. The option to split sector cells equally between zone cells will divide the sector contents equally between all the zone-to-zone pairs in the sector.
The third expansion option is to split sector cells proportionately between zone cells. This requires a Zonesplit file to be entered in the Input zone pattern file text box (see the example below). This file should have a Comma Separated Variable format in the form Sector Number, Zone Number, Fraction. Each sector number is repeated on as many records as there are zones between which it is to be split, followed by the number of one of the zones into which it is to be split and then the fraction (expressed as a decimal) of its trips that are to go to this zone. Using this format it is possible to assign all the trips in several sectors to just one zone by putting 1 as the fraction. It is therefore possible to squeeze some parts of the matrix while expanding others.
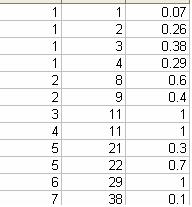
This example shows sector 1 in the input matrix being split between zones 1 to 4 in the output matrix and sector 2 being split between zones 8 and 9 in the new system. Sectors 3 and 4 are both assigned entirely to zone 11 i.e. they are being squeezed to one new zone. Sector 5 is split between zones 21 and 22 and sector 6 is assigned to zone 29, i.e. it is just renumbered.
Click the Expand button to expand the matrix.
Matrix conversion
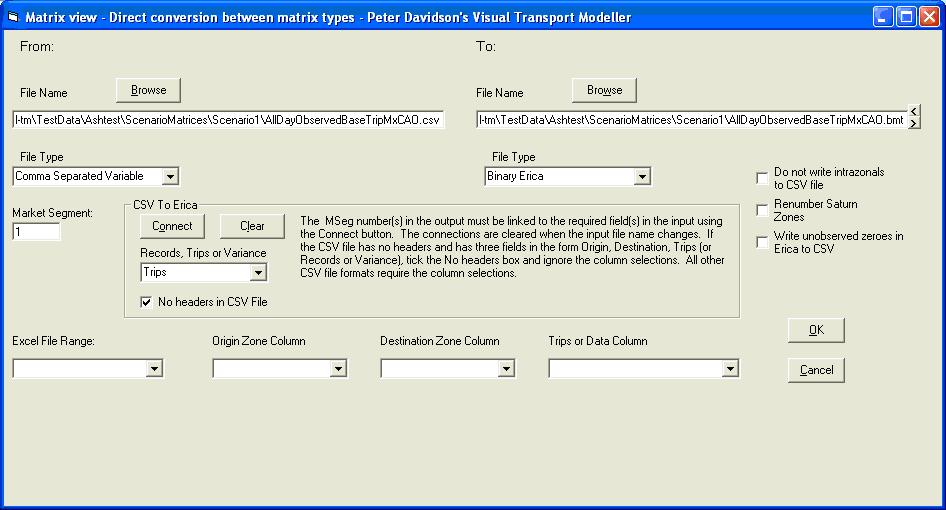
It is possible to convert certain matrix types directly into certain other matrix types without having to open the matrices on the grid and save them from it. This is particularly useful for large matrices as these take time to load up on and save from the grid display. To do this, choose the Convert option from the Matrix Calculations sub menu on the Matrices Menu. The form that is displayed has text boxes and browse buttons for inserting the names and paths of the input file and the output and a box in which the Market Segment of a binary Erica matrix to be converted must be entered if it is to be converted to SATURN or TRIPS. For the other output types, all Market Segments in a binary Erica matrix are converted.
A printed ERICA matrix may only be converted into a binary ERICA matrix and an error message will be displayed if an attempt is made to convert it into any other type. A binary ERICA matrix can only be produced from a printed ERICA matrix, a Saturn matrix, an Excel database file or a Comma Separated Variable file.
The Segmented RPM Text option may only be produced from a Market Segmented binary ERICA Trips matrix produced by the Rail Passenger Matrix program. These matrices have seventeen Market Segments and this conversion option produces a text file with one O-D pair per row. The origin and destination zone numbers are in the first two columns followed by the seventeen market segments.
An Excel database file may be converted to a binary ERICA matrix where an Excel database file is taken to mean any Excel file in which trip data is written on consecutive rows. Note that this is not the same as an Excel matrix file where each row in the file has all the trips from one origin zone - an Excel database file has data relating to just one O-D pair per row. Data is read from an origin zone column, a destination zone column and a trips column. Browse to the input file and select the required range from the Excel File Range drop down box. After clicking on Go the column numbers for the origin zone, destination zone and trips columns are requested. 1 corresponds to Column A and 26 to Column Z, for example.
A binary ERICA file can be converted to comma separated variable format. A single market segment can be converted to a file in the form Origin, Destination, Trips or a number of consecutive market segments can be written out in the form Origin, Destination, MSeg X, MSeg Y etc. The required Market Segment or range of Market Segments e.g. 2-7 is entered in the Market Segment text box.
There are several options specific to conversion from binary Erica to Comma Separated Variable files. The Do not write intrazonals to CSV matrix tick box will prevent any intrazonal O-D pairs in the binary file from being written to the CSV file. The tick box entitled Do not write out zero cells to CSV matrix will prevent an O-D pair from being written to the CSV file if none of the required market segments have any trips for that O-D pair. If the Zone Dictionary option is used, the CSV file format will be as described above except that the zones will be renumbered as specified. The Zone Dictionary format is described in Section 6.8.7.
To convert more than one field from CSV to binary Erica format, the CSV file must have a single line of comma-separated headings that gives a name for each field. When Comma Separated Variable is chosen as the input file type, these headings are read into the Origin, Destination and Trips or Data Column drop down boxes. The headings corresponding to the Origin and Destination columns must be selected in the appropriate box. The trips or other data in the CSV file are written into any desired market segment number in the binary Erica file by selecting the column heading and entering the desired market segment number in the Market Segment text box. Then click the Connect button to link the two together. Repeat for each required field in the CSV file. The Clear button will clear any such links already made, as will changing the input file name. Any or all of the CSV file fields can therefore be written to the output.
If a CSV file has three fields in the order Origin, Destination, Trips (or other value), this can be converted to binary Erica without any headers in it. Tick the No headers in CSV file tick box and ignore the column selections. Enter a market segment value as the data will be written into this Market Segment in the output file.
The Records, Trips or Variance drop down box determines whether the values are written to the binary Erica file as records, trips or variances. Conversion of a CSV file with just an Origin zone column, a Destination zone column and a single field of data into a binary Erica file with the data in Market Segment 1 would be done as follows:
Note that for each click of the OK button, all the selected fields will be written as Records, Trips or Variances. If you wish to write, for example, Trips and Variance fields from a single CSV file to a single Binary Erica file you would select either Trips or Variance first and do the conversion. Then select the other field and add it in to the Binary Erica file by clicking the OK button again.
A CSV file may be converted to Saturn. A Saturn file can be rezoned using a zone dictionary, but this cannot be done during the conversion. If this is wanted, convert the matrix first and then tick the Renumber Saturn Zones tick box. Then select the zone dictionary and range and enter the number of zones before clicking OK.
Tripends files
When a matrix has been opened with the Matrix Editor and is displayed on the grid, its Trip Ends may be derived by using the Derive Trip Ends option on the Edit Matrix Menu, which is available when a matrix is displayed. Three columns of data are displayed alongside the zone number: trips originating in the zone, trips terminating in it and the intrazonal trips. The trip ends may be saved to a text file using the Save As option on the File sub menu on the Matrices menu. This displays the form for selecting the file name and type. Enter a name for the file, select Text Trip Ends as the type and click OK to save the file. This Save Trip Ends As option should only be used once the trip ends have been derived it only saves the displayed trip ends and will not derive then for a displayed matrix.
The format of the saved Trip Ends file is a text file with one record per zone and three fields per record. These three fields are the number of trips originating in the zone, the number of trips terminating in it and the number of intrazonal trips. The final row gives the column totals.
A text Trip Ends file in this format can also be read in and displayed on the grid by using the Open option on the File sub menu on the Matrices menu. Select Text Trip Ends as the type. There is also an Excel Trip Ends option that reads in trip ends in the same format as the text file from an Excel file. They have to be in the same three-column format and in a range called Matrix. The first row should have headers and the final row should have the column totals.
Trip ends can also be saved from the grid to a range called Matrix in an Excel file by selecting the Excel trip Ends option when saving. The range must have two rows more than the number of zones one for headers and one for the column totals.
An alternative way to derive Trip Ends without having to load the matrix onto the grid is to go to the Matrices menu, then select Derive Trip ends File from the Matrix Calculations sub menu. Browse to the required binary ERICA matrix, and type the required market segment into the text box. Browse to select an output Trip Ends file, which will take the same format as described above. However, a Trip Ends file derived in this way will not contain a final row giving the column totals.
Distance matrices
Visual-tm can be used to produce a matrix whose cells give the distances between the zone centroids of a digitised zone boundary file. The zone boundary file must be in MapInfo Interchange Format (.mif). The centroids are calculated by reading all the co-ordinates that define a zone and finding the maximum and minimum Easting and Northing in the zone. The half way point between the maximum and minimum is then taken as the centroid. The distance matrix is a binary ERICA or CSV file that holds the distances between every pair of zones in the .mif file.
To create a distance matrix select Administrative Boundaries from the View menu to open the window below. Browse to the zone boundary .mif file and click Plot File followed by Remove Deletions. The zone system is now displayed on the screen:
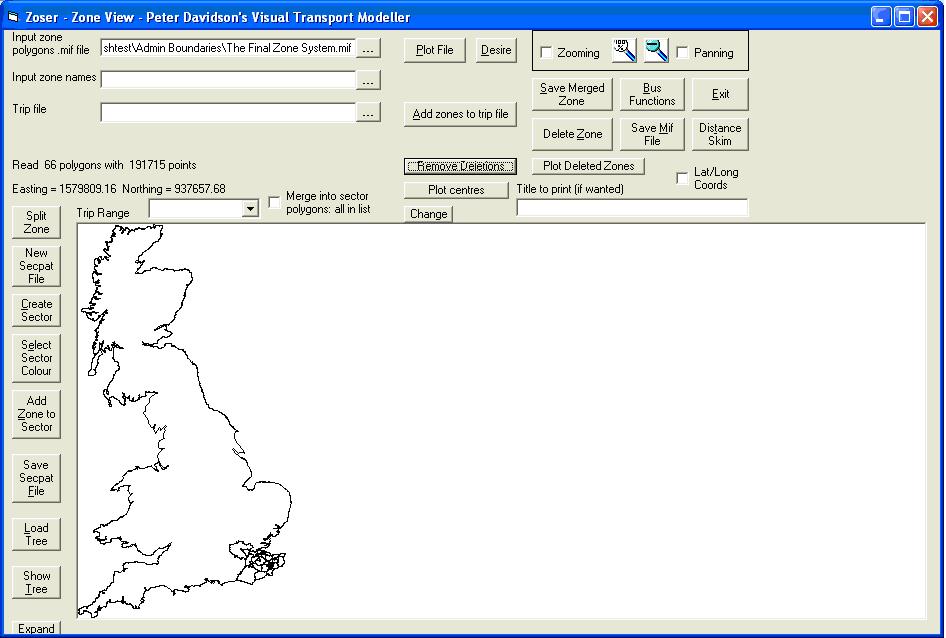
Click the Distance Skim button and browse to the location for the output file. Enter a name for it and click Open and the file will be created.
Trip Length Distribution
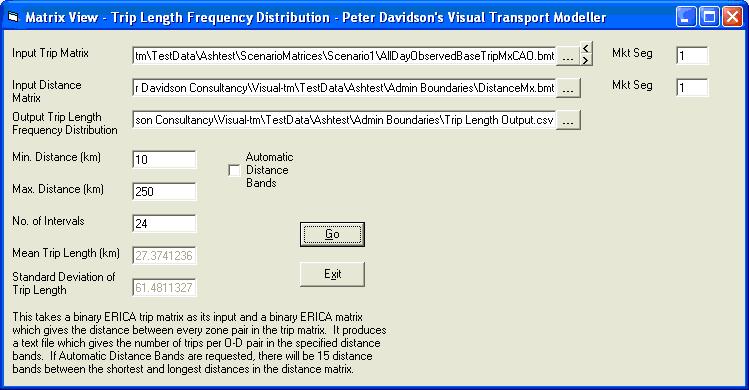
A distance matrix may be used in conjunction with a trip matrix to produce a text file that gives the trip length distribution in the trip matrix. This is done using the Trip Length option on the Distribution Sub Menu. This displays a screen on which the name of the trip matrix is entered along with the name of the distance matrix and an output file. This is a text file that lists distance bands against the average number of trips between a pair of zones separated by that distance. The final column in the output file gives the number of zone pairs that are separated by that distance.
A minimum distance, a maximum distance and the number of distance bands between them should be entered in the appropriate text boxes. The number of distance bands written to the text file is two more than the number specified in the No. of Intervals text box. The first distance band in the file is for pairs of zones that are separated by less than the minimum distance specified. The last distance band is for zones separated by more than the maximum distance specified. Zones separated by a distance between the minimum and maximum are split into the number of distance bands given in the No. of Intervals text box.
There is also an option to have the distance bands chosen automatically, which is done by ticking the Automatic Distance Bands box. The result is an output where the minimum distance is the smallest distance in the distance matrix and the maximum distance is the maximum distance in the distance matrix. There will be fifteen distance bands if this option is chosen.
If 24 intervals are specified between a minimum distance of 10km and a maximum of 250km there will be 26 distance bands in the output file. The first will be for zones separated by less than 10km and the rest will be for 10km wide bands except for the final one, which is for all zones separated by more than 250km. The number in the left hand column gives the start of the distance range covered by the band and the right hand column gives the average number of trips between a pair of zones separated by that distance. The mean trip length and the standard deviation of the trip length distribution are displayed on the screen when processing has finished:
Census Matrix Tools
Census Matrix Tools is a piece of software used to build journey to work trip matrices from a compendium of data sources including the ONS National Census and the National Travel Survey. Further details on CMT can be obtained through PDC.
Large matrices
The matrix editing grid can only hold matrices that have up to 590 zones. If a matrix is larger than this and is in Binary ERICA format, 500x500 sections of it can be loaded on the grid by selecting the Binary ERICA500 matrix type when opening the matrix. As with other binary ERICA matrices, the records, trips or variance values may be selected.
Similarly, comma separated variable matrices with over 590 zones may be viewed by selecting Comma Separated Variable 500 as the matrix type.
If a matrix editing option is then chosen and applied to the whole of the displayed section of the matrix, the change will automatically be applied to the whole of the matrix and the file will be rewritten accordingly.
Large matrices can be created on your hard drive in either binary ERICA or comma separated variable format from the New Matrix form. If the number of zones entered is greater than 500, the matrix will be written directly to disk instead of on the grid. This can only be done with these two formats.
Back to tutorials On to matrix building