![]()
![]()
![]()
![]()
![]()
![]()
![]()
![]()
Visual-tm: Mode Choice Calculators
![]()
Back to tutorials Back to Mode Choice Models Peter Davidson Consultancy have developed 4 simple mode choice calculators to enable the user to quickly enter variables and view results to specific modelling queries.
Please note that these calculators use average UK coefficients from experimental measurements they are useful as a general guide only.
To open any of the calculators click Methods/Calculators followed by the calculator required.
Each of the calculators will now be discussed in turn.
Car versus Park & Ride calculator
The Park and Ride Calculator is a piece of software that can be used to calculate modal shift from car to a new park & ride scheme. It takes into account factors such as journey time, fares and parking costs. It is based upon the "Good Park & Ride Guide", a publication of the DETR and the English Historic Towns Forum.
The Scenario
The park & ride calculator is designed for a simple radial corridor. A person travelling to the city centre by car has 2 alternatives:1. To travel by car, and pay to park at the city centre with a walk to their final destination. This is the persons only alternative until you build a new park and ride, in which case he can:
2. Park at a new park & ride site, where a fast and frequent bus service is able to take passengers direct to the city centre, followed by a short walk from the bus stop to the final destination.
Instructions
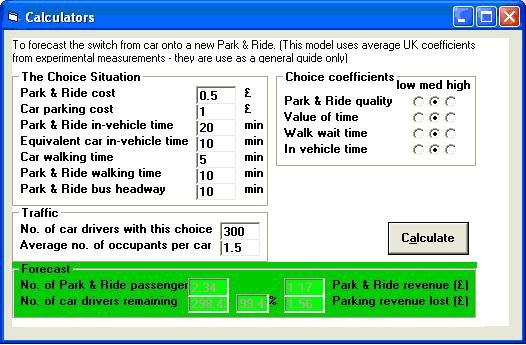
The calculator is very simple to use. The factors in the Choice Situation, Choice Coefficients and Traffic sections are user defined. The Calculator displays the results in the Forecast section in green at the bottom of the table. The definitions of all the factors are shown below.The Choice Situation
Park & Ride cost Combined cost of parking and bus fare for the park & ride journey (in pounds). Car parking cost Combined cost of petrol consumed in the journey and parking charges at the city centre (in pounds). Park & Ride in vehicle time Time taken for the park & ride journey to the city centre bus stop (in minutes). Equivalent car in vehicle time Time taken for the car journey to the city centre car park (in minutes). Car walking time Time taken to walk from the city centre car park to the final destination (in minutes). Park & Ride walking time Time taken to walk from the city centre bus stop to the final destination (in minutes) Park & Ride bus headway Frequency of the Park & Ride bus service (in minutes) The Choice Coefficients
The settings for the coefficients are low, med or high Park & Ride quality Takes into account factors such as the parking environment (purpose built or existing, pavement quality), standard of the bus (age, low-floor, driver experience) and the frequency of the service. Value of time The estimated cost to the traveller (in financial terms) of time spent travelling. Car drivers generally have a higher value of time than bus users. Walk/wait time The amount of time between parking their car to actually boarding the bus and leaving for the city centre. This is usually dictated by the size of the park & ride parking area and the number of bus stops contained within the site. In-vehicle time The speed of the service from the Park & Ride site to the city centre. Usually dictated by the number of stops the bus makes and the standard of priority measures on the route. The Traffic Situation
No. of car drivers with this choice The number of drivers travelling to the city centre Average no. of occupants per car Total number of persons travelling by car divided by the number of cars. The Model's Forecast (i.e. the model output)
No. of Park & Ride passenger Total number of car drivers and passengers converted to the park & ride service. No. of car drivers remaining Those drivers who will continue to travel to the city centre by car, shown both as a total number and a percentage. Park & Ride revenue Income gained from the park & ride service (fares and parking). Parking revenue lost Income lost from parking charges in the city centre as a result of the park & ride service. Car versus Cycling calculator
The Scenario
The car versus cycling calculator is designed for a simple radial corridor. A person travelling to the city centre by car has 2 alternatives:1. To travel by car, and pay to park at the city centre with a walk to their final destination.
2. To cycle to the city centre and to park the bicycle near or at their final destination and walk the rest of the way.
Instructions
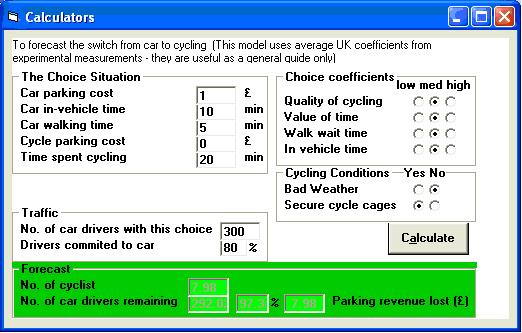
The calculator is very simple to use. The factors in the Choice Situation, Choice Coefficients, Cycling Conditions and Traffic sections are user defined. The Calculator displays the results in the Forecast section in green at the bottom of the table. The definitions of all the factors are shown below.The Choice Situation
Car parking cost Parking charges at the city centre (in pounds). Car in vehicle time Time taken for the car journey to the city centre car park (in minutes). Car walking time Time taken to walk from the city centre car park to the final destination (in minutes). Cycle parking cost Charges for the cycle cages (If none are available input 0). Time spent cycling The time it takes to cycle to the destination. The Choice Coefficients
The settings for the coefficients are low, medium or high Quality of cycling Takes into account the quality of the cycle route. A segregated cycle route will usually be of higher quality. Value of time The estimated cost (in financial terms) of the time spent travelling. Car drivers generally have a higher value of time than cyclists. Walk/wait time Walk time after parking their bicycle to their destination. In-vehicle time Total journey time by bicycle to the cycle parking place. The journey time is usually thought to be less if a segregated cycle route is used. Cycling conditions
The settings for the conditions are either Yes or No Bad weather Weather conditions that would deter most people from cycling. Secure cycle cages Determines if secure cycle cages are available at the destination. The Traffic Situation
No. of car drivers with this choice The number of drivers travelling to the city centre Drivers committed to car Percentage of car drivers who will not change to cycling under any circumstances. The Model's Forecast (i.e. the model output)
No. of cyclists Total number of car drivers converted to cycling. No. of car drivers remaining Those drivers who will continue to travel to the city centre by car, shown both as a total number and a percentage. Parking revenue lost Income lost from parking charges in the city centre as a result of the switch to cycling. Car versus Walking calculator
Scenario
The car versus walking calculator is designed for a simple radial corridor. A person travelling to the city centre by car has 2 alternatives:1. To travel by car, and pay to park at the city centre with a walk to their final destination.
2. To walk all the way to their final destination.
Instructions
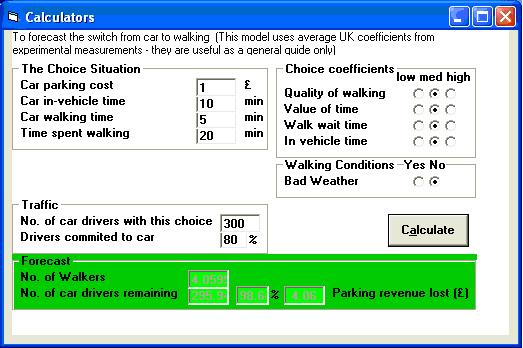
The calculator is very simple to use. The factors in the Choice Situation, Choice Coefficients, Walking Conditions and Traffic sections are user defined. The Calculator displays the results in the Forecast section in green at the bottom of the table. The definitions of all the factors are shown below.The Choice Situation
Car parking cost Parking charges at the city centre (in pounds). Car in vehicle time Time taken for the car journey to the car park (in minutes). Car walking time Time taken to walk from the city centre car park to the final destination (in minutes). Time spent walking Time it takes to walk to the destination The Choice Coefficients
The settings for the coefficients are low, med or high Quality of walking Takes into account the quality of the walking route. A segregated route will usually be of higher quality. Value of time The cost to the traveller (in financial terms) of the time spent travelling. Car drivers generally have a higher value of time than walkers. Walking conditions
The settings for the conditions are either Yes or No Bad weather Weather conditions that would deter most people from walking. The Traffic Situation
No. of car drivers with this choice The number of drivers travelling to the city centre Drivers committed to car Percentage of car drivers who will not walk under any circumstances. The Model's Forecast (i.e. the model output)
No. of walkers Total number of car drivers converted to walking. No. of car drivers remaining Those drivers who will continue to travel to the city centre by car, shown both as a total number and a percentage. Parking revenue lost Income lost from parking charges in the city centre as a result of the switch to walking. The Elasticity Model of Demand Calculator
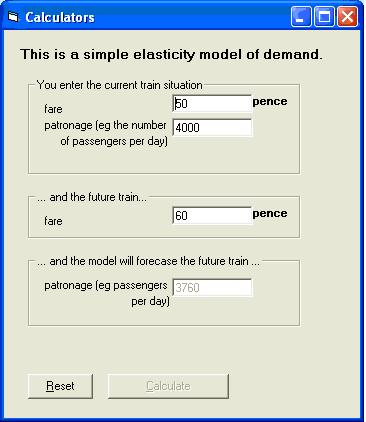
This calculator is very simple. Enter the current train fare and the current number of passengers. Then enter the proposed new fare and click Calculate. The calculator will quickly calculate a predicted number of passengers. Click Reset to go back to the original settings.
Back to tutorials Back to Mode Choice Models