![]()
![]()
![]()
![]()
![]()
![]()
![]()
![]()
Back to tutorials On to matrices Covered in this section:
- Creating a new base year network
- Modifying an existing network
- How to code other elements of your network
- Scenario networks
- Error checking
- Viewing and displaying networks
- Accessing network information interactively
- Using the Map
- Other mapping functions
- Creating a network from cif files
- Trouble Shooting
Creating a new base year network
Let’s start by creating a new project as described in chapter 17. If there is a zone system for this project in MapInfo Interchange Format then it can be copied into the project’s System\Working directory and renamed World.mif. When the project is re-opened this zone system will then be displayed. In the example below the World.mif file from the Ashtest test data project has been copied to the new project.
The background of the network display is always provided by a file called World.mif that is stored in the System\Working directory in your project folder. For further details on the structure of a .mif file please see [the data section of this manual]. Please note that if you do not have a digitised zone system, you should create a .mif file with one zone that covers the entire geographical area of interest i.e. it includes the entire network.
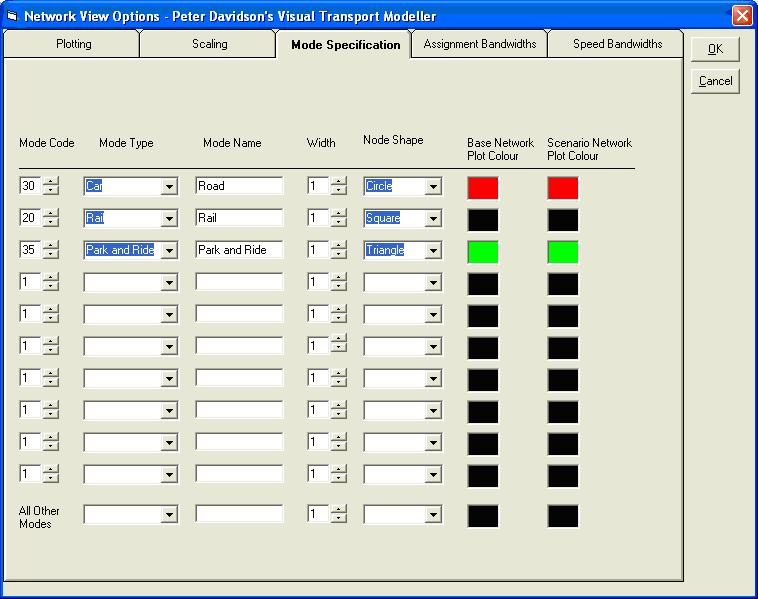
The first step in creating a network is to define the mode or modes on the Mode Specification tab on the Display Options form:

In this example just one mode has been set up.
Important: The mode names must not contain spaces, as any which do will be ignored when building best paths.
Your new project should then be saved and reopened. The project is now configured for the network to be created by adding nodes and links.
Adding nodes
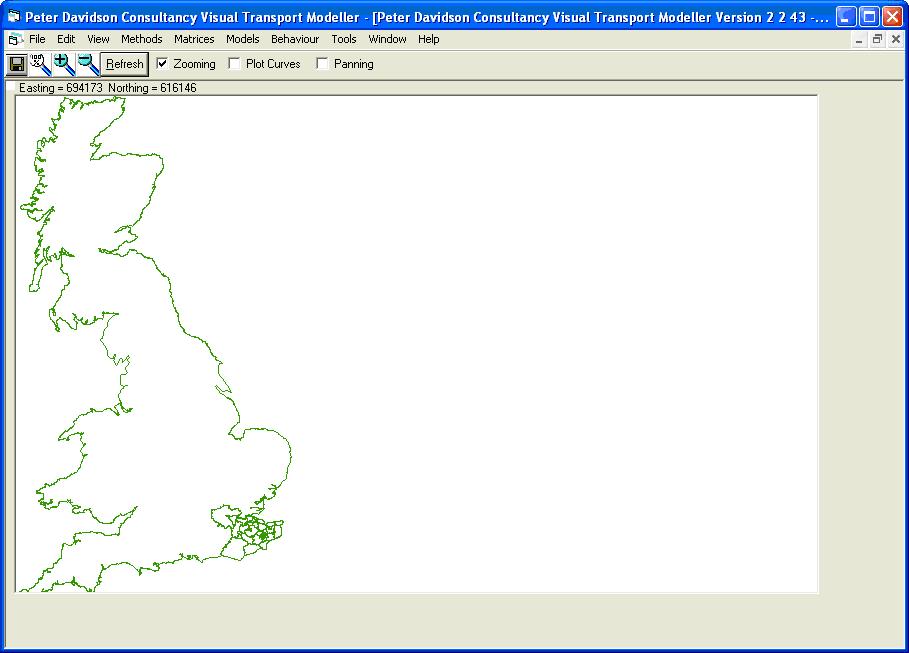
To add a node to the network click Edit/Current Network Scenario/Add New Node. You will be prompted to click on the display where you wish to place the node: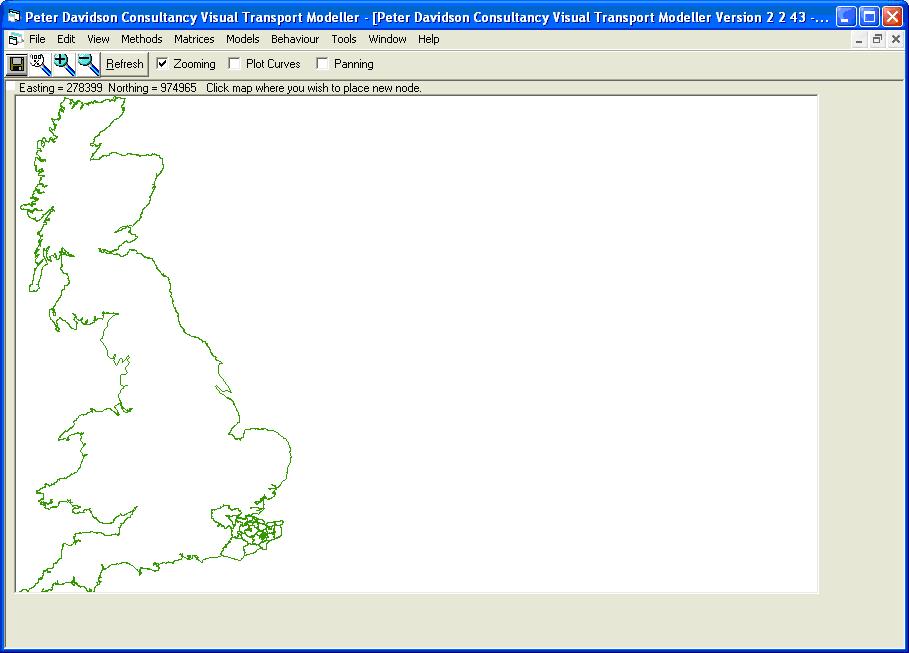
Above the display Easting and Northing coordinate are displayed. These give the current position of the mouse cursor and are useful in locating where to place your nodes. When you position the node the New Node form opens:
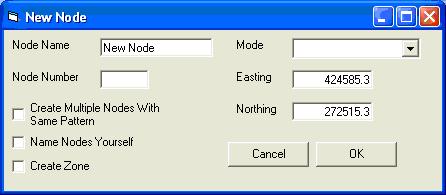
Enter the Node Number and Mode. The Node Name, Easting and Northing may be edited if desired.
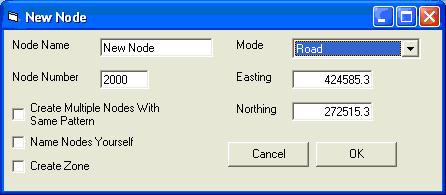
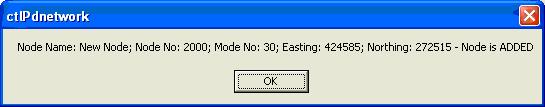
When the form is set up click OK and the node will be created. A form confirming its details will be displayed:
Adding links
When two or more nodes have been created, links can be added to the network. To do this click Edit/Current Network Scenario/Add New Link. You will be prompted to click the A node of the link and then the B node. The form below then opens: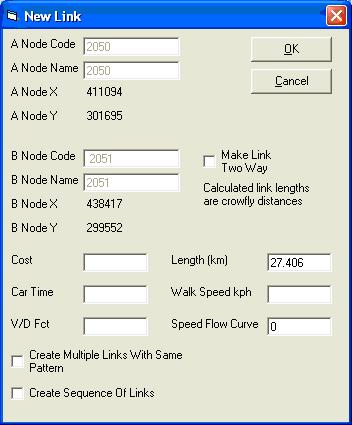
The generalised cost, car time, volume delay function, length, walk speed and speed flow curve of the link should be entered. The length is calculated automatically as the straight line distance between the nodes. The speed flow curve number can be left as zero if there are not yet any speed flow curves in the network. The Make Link Two Way box can be ticked if it is to be a two way link with the same properties in both directions.
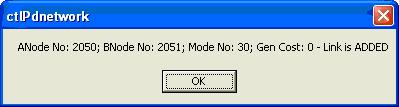
When the form is set up click OK and the link will be created. A form confirming its details will be displayed.
Adding zone centroids and zone connectors
Zone centroids are created in the same way as nodes. On the New Node form the Create Zone box should be ticked: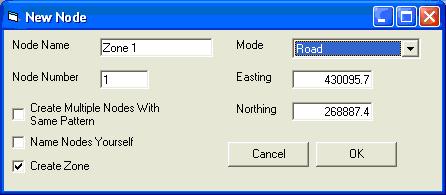
Zone connectors are created in the same way as links. If a link is created between a zone centroid and another node then Visual-tm will automatically treat it as a zone connector rather than a normal link.
Saving the network
To save your network edits, click Edit/Save Network Changes. The network changes will be saved to the current scenario network file.Mode Penalties
The Node, Link and Zone Connectors data are the minimum required to load a network. In order to do a Highway Assignment, as described in Section 6.6.1, another set of data is required in the Project’s Base or Scenario network data spreadsheet. These are the Mode Penalties and they can be seen in the Ashtest test project. They are also in the pbexeTemplate.xls file in the Templates directory and should be copied from here to the Mode Penalties sheet in the Base or Scenario network data spreadsheet before running an assignment, if they are not already present.Modifying an existing network
Existing networks can be modified interactively using Visual-tm.
Editing nodes
To edit a node, click Edit/Current Network Scenario/Edit Node. You will be prompted to click the node (and drag it if required). If you want to change the position of a node, click it and drag it to its new location. Otherwise just click on it. The form below will open: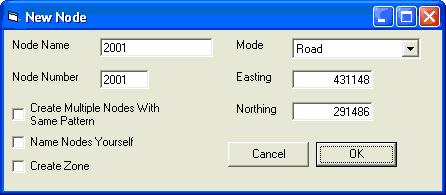
You may now edit the attributes of the node in the same way as when it was being created.
Editing links
To edit a link, click Edit/Current Network Scenario/Edit Link. You will be prompted to click the A node of the link and then the B node. The New Link form then opens and the link can be edited in the same way as when it was being created.Links can be deleted by clicking Edit/Current Network Scenario/Delete Link, then clicking the A node followed by the B node.
How to code other elements of your network
Public transport routes, speed flow curves, volume delay functions, fares, banned turns, mode penalties, link types, car parks, infrastructure, vehicles, companies, curves, junctions and platforms are all coded by entering data directly into the relevant sheet of the network spreadsheet. Please refer to chapter 5 for the format this data should take.
Park and ride
A park and ride car park is defined by a node and this node is connected to a node in the network by a link. These car park links must have their own infrastructure code, which for this network is 35. Each car park must also have its own zone, attached to it by a zone connector. The car parks are defined on the CarParks sheet in the network spreadsheet, with the car park node in column B and the network node to which it is connected in column C. The number of the car park zone is entered in column I and the infrastructure code for a normal zone connector is entered in column J. The car park capacity and car park charge are entered in columns G and H.The car park nodes and their zones must be defined on the Nodes sheet along with their coordinates. Do not define the associated links and connectors on the Links sheet as the program creates them from the data on the CarParks sheet.
Scenario Networks
A scenario network contains changes to the base network. The scenario network spreadsheet is in exactly the same format as the base network spreadsheet with the following exceptions:
Notice that the Nodes, Links and Zone Connectors sheets in scenario networks have an extra column on the left, with the heading a=add d=delete m=modify. An ‘a’ in this column followed by data means the data is added to the base network when the scenario network is loaded. An ‘m’ in this column should be followed by a node, link or zone connector which is in the base network, but with different attributes in the scenario. A ‘d’ in this column followed by a node, link or zone connector which is in the base network will delete that node, link or zone connector when the scenario network is loaded.
Extra routes may be added in a scenario file and routes that are present in a base file may be deleted in a scenario. The deletion is done by copying the route’s header line into the scenario file and then putting the letter ‘d’ in the next cell to the right of the header line. Examples of the format for routes can be seen in the Ashtest test data.
Path penalties can only be read in from a base file. Banned Turns, Vehicles, Functions and Fares data can be present in both the base and scenario files, but it is important to note that if they are present in a scenario file they will only be read from the scenario file and the ones in the base file will be ignored. The data in the scenario file therefore completely replaces the equivalent data in the base file, instead of being in addition to it, as is the case with links, nodes and car parks.
Error checking
Any errors encountered by the system when building the network are stored in the Error Report. Click View/Error Report to view.
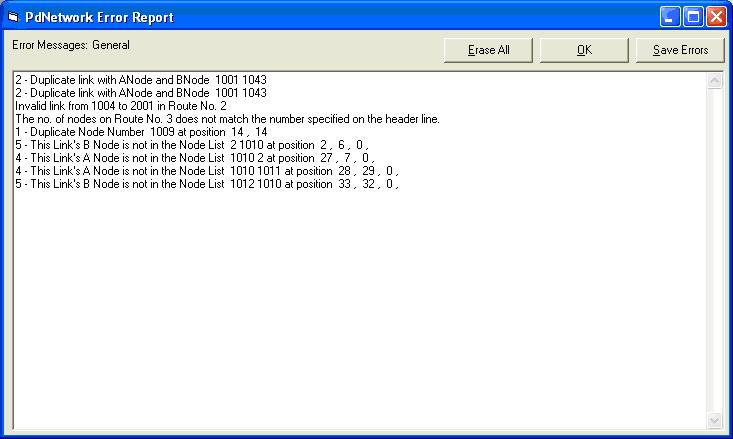
You can choose to erase them or save them. When they are written to the Report, they are also written to a file called ErrFile.txt in the System\Working directory.
Viewing and displaying networks
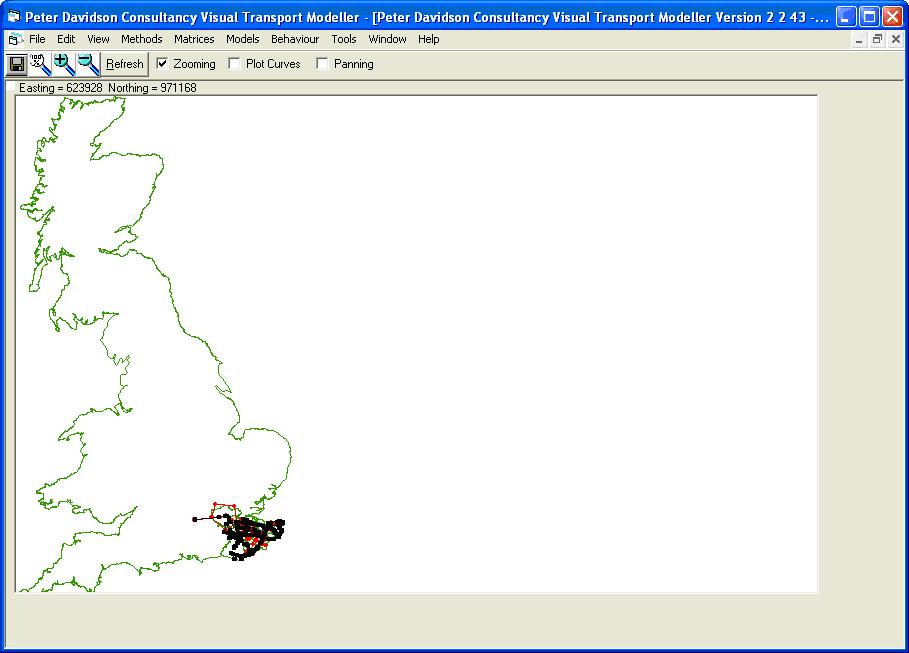
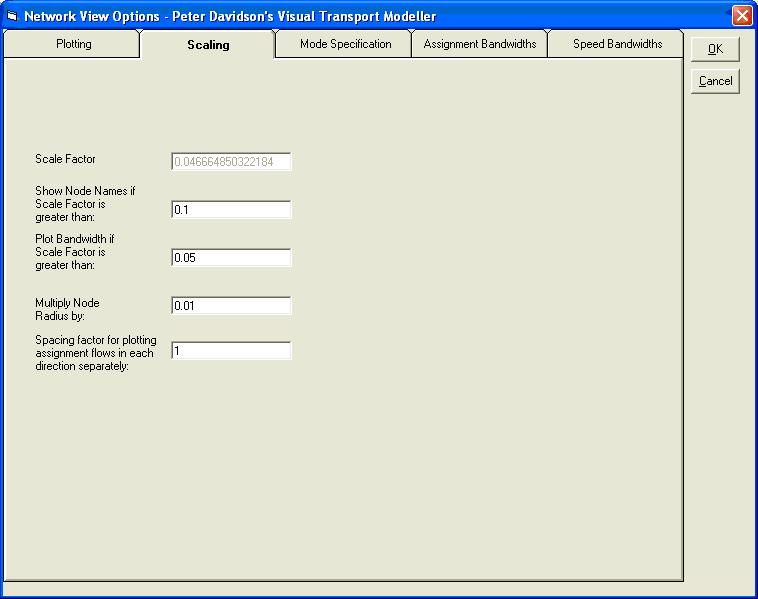
This is the standard network view of the Ashtest project. There are however additional viewing features that have yet to be discussed. For example click View/Display Options and the form below appears.
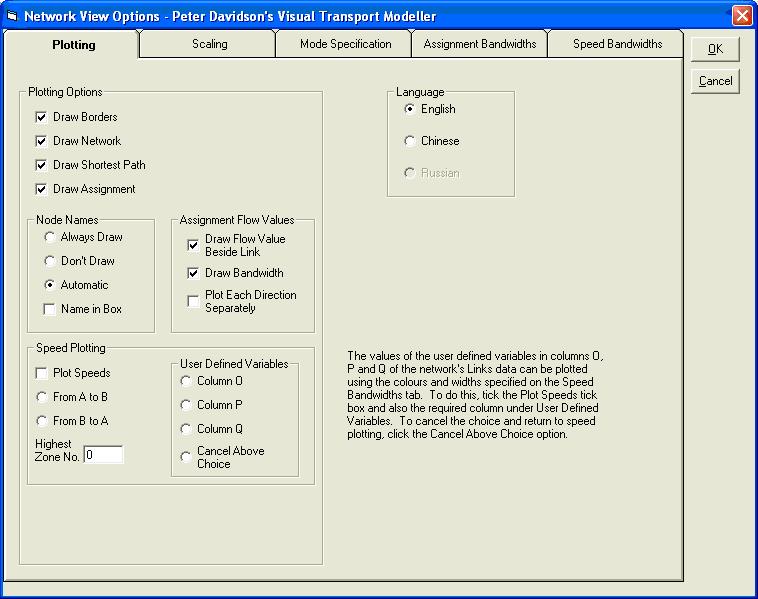
This is the Display Options form. Simply change the settings for this form to alter the way the network is viewed. These options are mostly self-explanatory and need not be discussed in further detail here, except for speed plotting.
If Speed Plotting is ticked, the links will be plotted with colours and line widths according to the link speeds in the network file. The colours and line widths to be used are set up on the Speed Bandwidths tab.
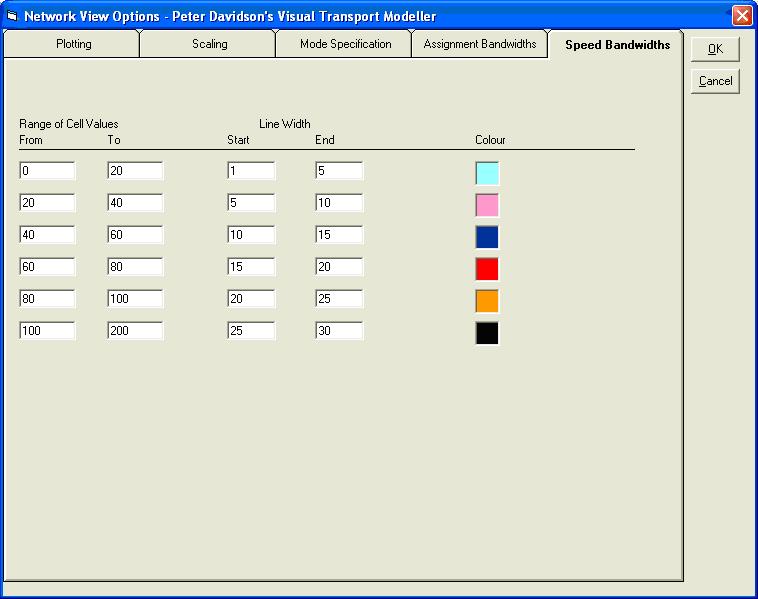
The links with speeds that fall within the ranges on the left will be plotted with the line widths and colours given on the right. The option buttons determine whether to plot the speed in the direction from A to B or from B to A in the case of two-way links, in case the speeds are different.
Instead of plotting the speed, it is also possible to plot one of the user-defined variables that may be entered in Columns O, P or Q of the Links range of a Network data spreadsheet. To do this, tick the Plot Speeds tick box and select the required column to plot. The resulting colours and line widths are determined by the settings on the Speed Bandwidths tab. To return to Speed Plotting, click the Cancel above choice option.
There are 3 other screens to this form (others shown below). Practice altering the viewing options to see the impact they have on the built network.
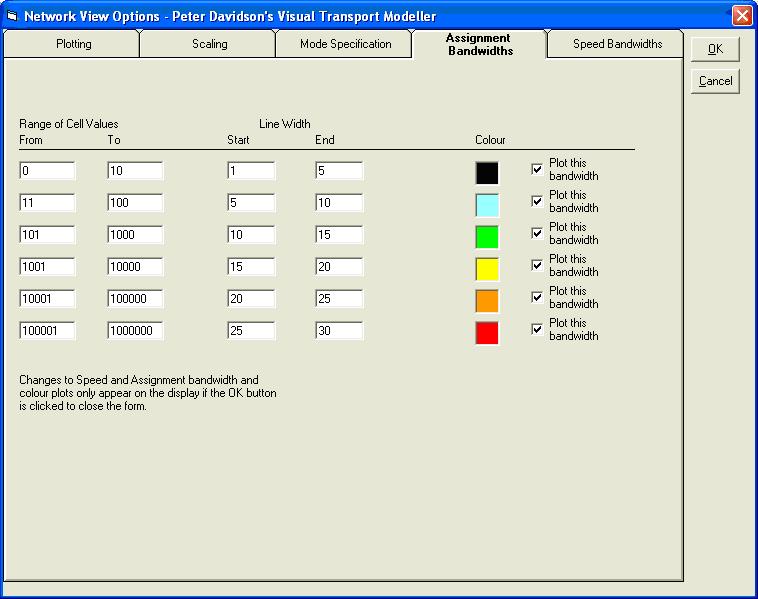
This tab determines the colours and line widths used to plot assignments and works in the same way as the Speed plotting.
To store the settings from this form click the Save button
on the main Visual-tm form.
Accessing network information interactively
You can also access Link or Node information through the network diagram. First click on a node (you may need to zoom in). The form below appears.
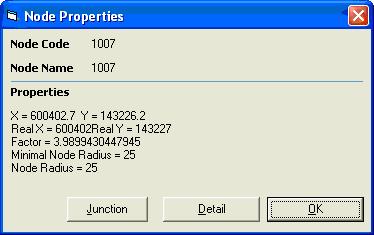
This shows some basic information on the node you have just clicked on. If you Click Detail on this form it expands to show.
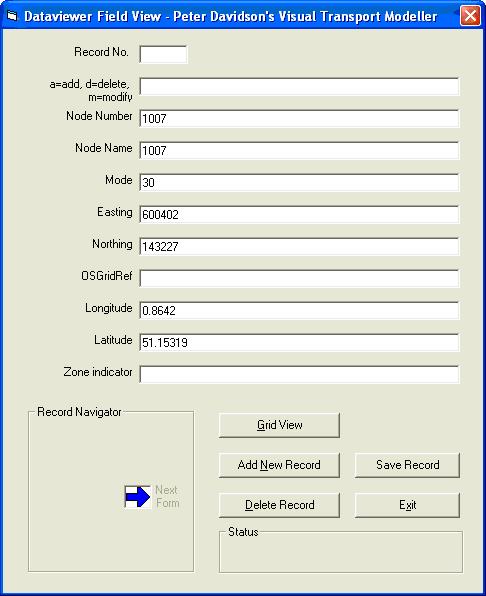
Do not use this form to edit and save information relating to that particular node. To edit nodes either use the option on the Edit menu or open the above form through the Dataviewer, from where it can be used to edit and save information.
Click OK to close the Node Properties form.
Now click on a Link (you may need to zoom in). The form below appears.
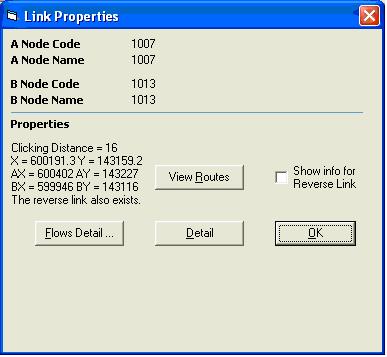
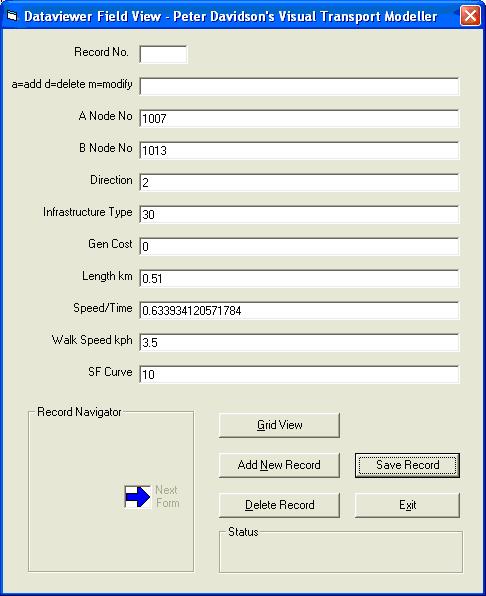
Again you can see the basic details pertaining to the link. Click Detail to expand the form (below). Note that where the link is two-way, you are informed that the reverse link also exists. If you tick the Show info for Reverse Link check box, clicking Detail will display the information for the reverse link.
If an assignment has previously been run on the network you can click Flows Detail on the Link Properties form to show the predicted number of trips on that particular link. This information is presented on the form below.
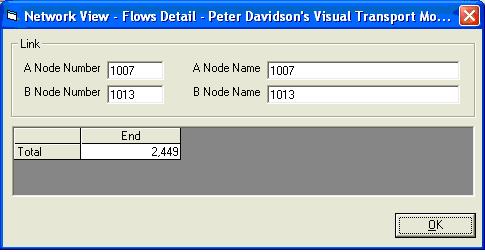
Click OK to close the Flows Detail form.
Click OK to close the Link Properties form.
Using the Map
The advanced mapping functionality of Visual Transport Modeller requires MS MapPoint to be installed on the user’s machine. To utilise the full functionality of MS MapPoint please refer to the MS MapPoint help files provided with the software.
Visual-tm will only work with MapPoint if MapPoint is installed on the machine after Visual-tm is installed. If MapPoint is already on the machine, it will have to be reinstalled after installing Visual-tm. Any reinstallation of Visual-tm will also require a reinstallation of MapPoint.
MapPoint can only plot the network if the coordinates of the nodes are given in Latitude and Longitude in the Nodes ranges in the base network and any scenario network files that are being used. Before using the map display, open each of these network files in turn and run Macro1. This calculates the Latitude and Longitude of the nodes from the OSGRs and writes them in subsequent columns.
Important: The converter is designed to convert British OSGR coordinates. It will not work on foreign systems and even if their coordinates were expressed relative to the origin of the Ordnance Survey system, they would not be plotted accurately and the errors would increase with distance from Britain. Macro1 in the network files should therefore only be used with British data. The map display will work worldwide, but the user will have to obtain the latitude and longitude of their nodes from another source.
Display Basics
The Ashtest test data set can be used to illustrate the use of the map display. The Latitude/Longitude conversion has already been run on the relevant files.If MS MapPoint is installed, open the project and click View/New/Map. The Map View will open and the nodes will be plotted:
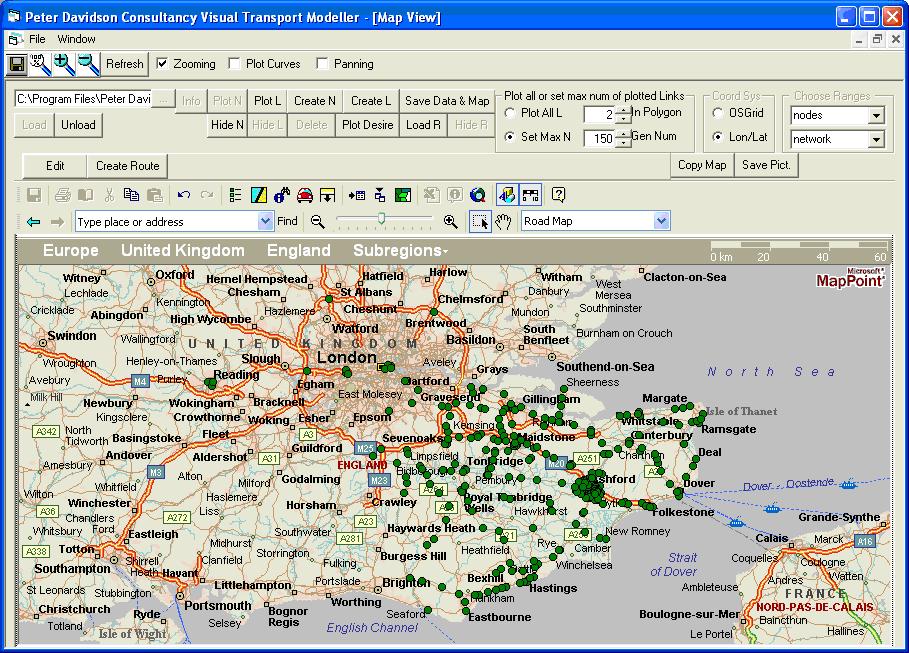
On loading, the map zooms in automatically on the network and plots only the nodes. Plotting the links takes longer and is done by clicking the Plot All L option button and then the Plot L button. The links are plotted as thin black lines. If you click the Plot L button without choosing the Plot All L button first, a message will appear asking you so select a node first. Click on one and then click Plot L again. A small number of links around the selected node will be plotted. This option may be preferable if you have a large network and are only interested in a small part of it at the time, as it may take a long time to plot all the links. The links can be hidden by using the Hide L button and redisplayed using Plot L again.
If you click the Save Data & Map button, the current map display screen settings will be saved to a file called Network.ptm in the project’s System\Working directory. This is created when the map display is first opened in a project and subsequently it is this file that is used to plot the network when the map display is opened. Note that the network loads far faster from it – in particular the links are plotted about ten times faster.
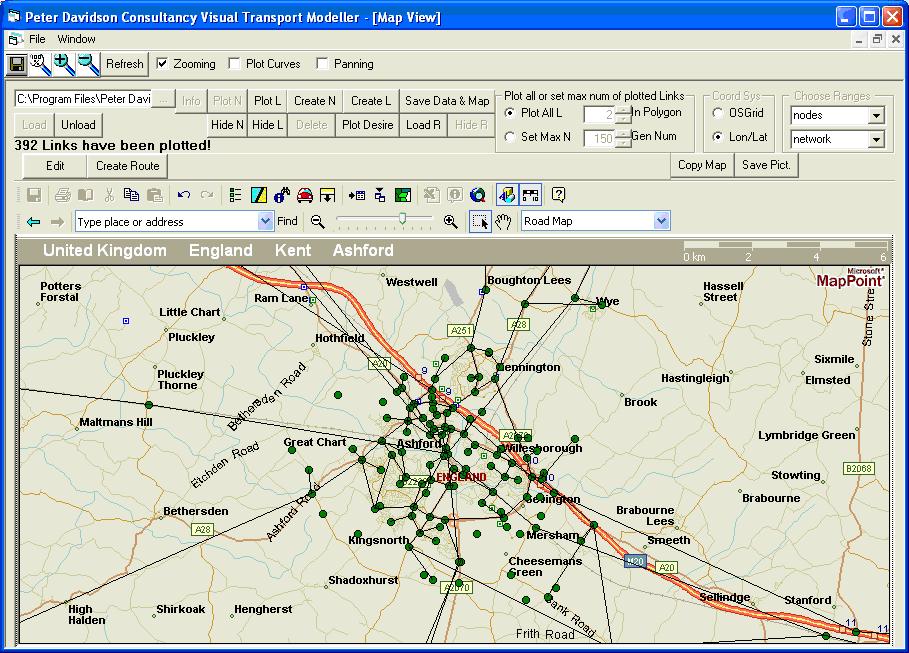
The two magnifying glasses just above the map zoom in and out by fixed amounts. The square with the arrow next to Zoom In will zoom in on a region of the display selected by the user. Click and drag across part of the map and the click within the box that this defines. For the network in and around Ashford, the following is seen if the links have been displayed.
Clicking on the hand symbol allows you to pan across the map and if a node is selected by clicking it, the information button
will cause its name and coordinates to be displayed. The Info button will display its node number and mode number. If you try to select a node and the node at the other end of a link coming from it is selected instead, try again while holding down the Ctrl key. To select a link, it is necessary to press the Ctrl button when clicking the link. The Info button will then give its ANode and BNode numbers and its mode.
Modifying Networks
The Map provides an easy way of modifying networks, as nodes can be moved, created or deleted and links can be created or deleted in a similar manner to that used in the Network display.Moving Nodes
To move a node, just click and drag it. A message will be displayed, confirming that it has been moved and giving its name, number, mode and new coordinates.Creating Nodes
To create a node, click the Create N button. A message will ask you to click the map where you want the new node to be. Click the location to create the node. It will be at the first point clicked – you can’t zoom in on somewhere at this point so the precise location must be visible at the time when you click Create N.The Parameters of New Node form will then be displayed on which the name and number for the new node are entered. A list of all unused numbers up to 9999 is provided.
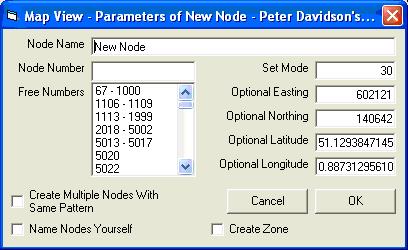
A number from the available ones on the list must be entered and a name can be given to the node. The mode number and coordinates may also be edited if desired. Click OK. The node will be created as a red circle and a message displayed confirming its details.
Deleting Nodes
Click on the node and then click the Delete button. A message asks you if you wish to delete it only from the map or from the source file also or if you wish to cancel the deletion. The first removes it from the display, but it will remain in the files and will be redisplayed when the network is next loaded. The second removes it altogether. The links that are attached to the node are also deleted. The Delete key on the keyboard will also delete nodes, but the attached links will only be removed when you next click on the map. Deletion from the Delete key will occur without an option to cancel being given. The Delete key should not be used to delete nodes, as it does not “tidy up” afterwards and causes problems.Adding Links
Click Create L. You will be prompted to click the A node of the link and then the B node. Hold Ctrl when clicking the nodes. The form below then opens: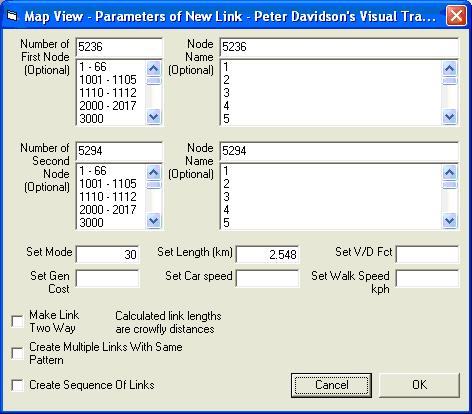
Enter values for the properties in the text boxes if desired. The new link will be one way from the first node to be second node. If it needs to be two way, add a link in the opposite direction by ticking the Make Link Two Way tick box.
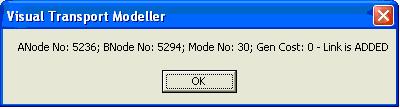
A confirmatory message will give the node numbers and mode number of the new link:
Deleting Links
Select the link, remembering to hold down the Ctrl key and click Delete. As with nodes, a message asks if you want to delete only from the display or from the file also. A confirmatory message gives the node numbers on the deleted link. The Delete key on the keyboard will delete the link without giving an option to cancel or delete from the display only. The Delete key should not be used to delete links, as it does not “tidy up” afterwards and causes problems.Saving Changes
The changes that are made to the display will only be saved to the Network.ptm file that holds the network for MapPoint if the Save Data & Map button is clicked. If you wish to save the same changes to the network that is seen on the network displays and is held in Excel files, click Save Network Changes on the Edit menu and the changes will be added to the Road.xls file in the current Scenario.Network Building
The above operations provide everything necessary to build a network and are a convenient way of doing it, especially if the node coordinates are not known. It may, however, be necessary to provide one “seed” node in a network spreadsheet file if you are clicking the map to add new nodes. Remember that both its OSGRs and its Latitude and Longitude will be needed. The template project contains such a seed node in the Base\Mode1.xls file, as MapPoint will not open in a manner that enables network changes to be made if there are no nodes present. This initial node is positioned at the origin of the Ordnance Survey Grid system i.e. in the Western Approaches and should either be moved to a position where a node is required, or deleted after the first nodes and links of the network have been created.Other Mapping Functions
Plotting Boundaries
Zone boundaries can be plotted in the map display if they are held in a spreadsheet. They can also be plotted from a Map Info .mif file. The Ashtest data includes an example of a Region file, containing ward boundaries in the Bristol area. It is called Regions.xls and is in the project’s Admin Boundaries directory. Click Load R and browse to this file. The boundaries are displayed and the area within them is displayed with a light blue background. The Hide R button removes this coloured background and the Unload button removes the boundaries.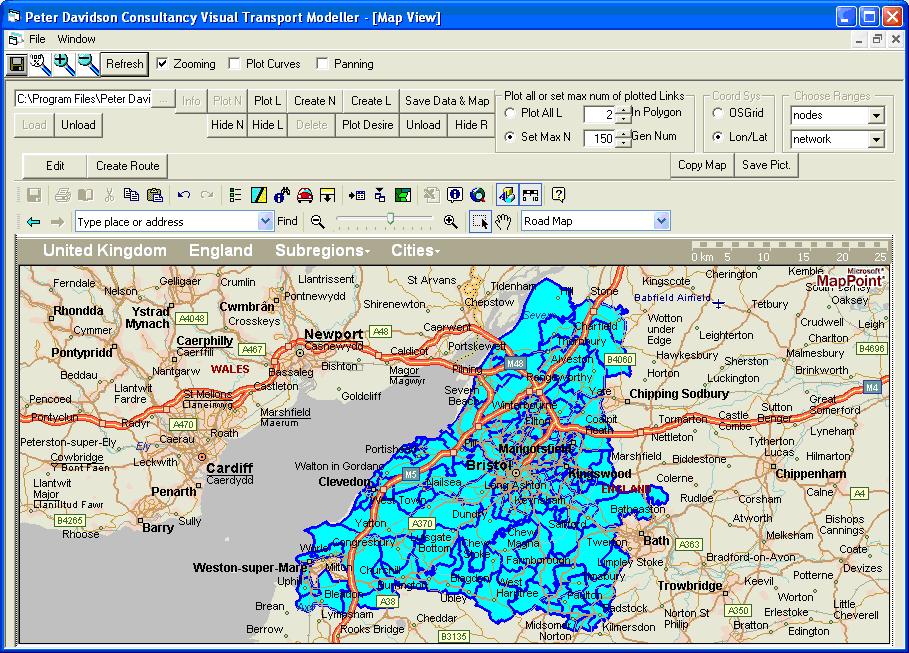
Individual zones can be selected and the selected zone will change colour. Holding down the Shift key enables a group of zones to be selected and holding down the Ctrl key allows zones to be removed from the group. A zone can be deleted from the display by holding down Shift and Ctrl and clicking the Delete key.
Clicking the Save Data & Map button will save the zone boundaries to the project’s Network.ptm file and they will be displayed when the map display is next opened in the project. Any zones that were deleted will be absent. These deletions are not saved to the spreadsheet so if this is loaded through the Load R button, all the zones will be displayed.
Regions.xls File Format
As in the example file, each zone needs to be on a separate sheet with the Easting and Northing in the first two columns and the Latitude and Longitude in the next two columns. The first line on each sheet should have headers. Macro1 in the file will convert Eastings and Northings to latitude and longitude for every sheet in the file. There should not be any sheets in the file with any other data.Saving Maps
The displayed map can be saved to any of various file formats by clicking the Copy Map button or the Copy button on the Map Point control, followed by the Save Pict button.Creating a network from cif files
A Public Transport network may be supplied in the form of CIF files that define the routes and all the services that run on them and Visual Transport Modeller provides the means to convert these into a usable network in the standard Visual Transport Modeller format. This is done on the CIF To Visual-TM Converter tab on the Accessibility form, which is opened by selecting Accessibility from the Models menu.
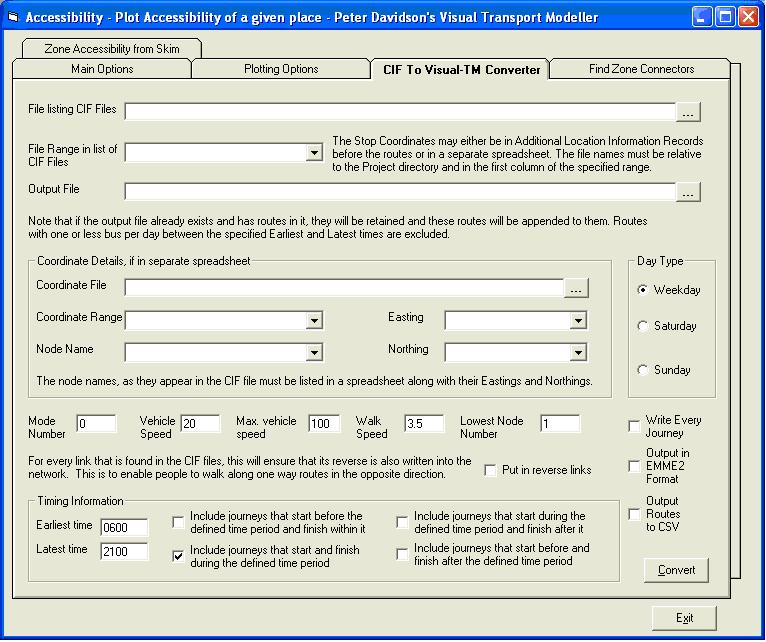
Although CIF files store the routes and journeys in a fairly standard format, there are two different ways of storing the locations of the bus stops. Sometimes they are listed at the start of the CIF file and sometimes they are held in a separate spreadsheet. The software has been written to handle both types. Also, if the “Put in reverse links” tick box is ticked, each link that is found in the CIF files will also have its reverse written to the output network. This is to enable people to walk along one way routes in the opposite direction.
The CIF files must be listed in a single column range in a spreadsheet or in the first column of the range if it has more than one column. The paths must be specified relative to the project directory of the Visual-tm project with which you are working i.e. the directory that contains the project’s PDC file. For example, if your project has a directory called PTData containing the CIF files you would list them as \PTData\File1.cif, \PTData\File2.cif, etc.
Select the file listing the CIF files as the “File listing CIF Files” and then choose the range with the data.
An output file name should be entered. Note that if this file already exists, the routes will be added to those already in it. The output file will be a standard Visual-tm network file with the data written to the Nodes, Links and Routes sheets, unless the Routes are requested in EMME2 or CSV format.
The required day of the week should be chosen. The network may be built for weekdays or for Saturdays or for Sundays.
A Mode Number or infrastructure code should be entered that will be applied to all the nodes and links. An earliest time and latest time should be entered in four-digit 24-hour clock format. Only journeys made at the specified times are counted. This enables peak or off-peak networks to be built. For all services throughout the day to be used, enter 0000 and 2400 as the earliest and latest times and tick all four of the Timing Information tick boxes. Values for the Vehicle Speed and Walk Speed should be entered.
A value for the Maximum Vehicle Speed should be entered. This is used to do a speed check on each link in the CIF files and if the speed on the link is found to exceed it, a note is made in the log file. This is to check for coding errors in the CIF file, as an incorrect stop would normally cause an excessive speed on the link.
A route will only be written to the file if there is more than one journey on it on weekdays between the earliest and latest times. All bus stops that are found in the CIF files will be written to the output file and this may include some that are not used by any of the routes that are not written out. This is not normally a problem as unused nodes are excluded when a project is opened and the network read, but it would cause problems when creating zone connectors as described in the next section. To solve this, all nodes that are used in the network have a number 1 written to Column G on the Nodes sheet, which is normally unused.
Visual-tm requires numeric node numbers so the alphanumeric codes in the CIF files are rewritten as numbers in the output files. It is a requirement in Visual-tm that the zone centroids are nodes whose numbers are less than those of the road or route nodes (bus stops) so a number must be entered in the Lowest Node Number text box that is one greater than the number of zones you wish to have. The bus stop nodes will then be numbered starting from this number.
For use in Visual-tm the three tick boxes in the bottom right hand corner of the form should be left unticked. They allow the routes to be output in EMME/2 format and every journey in the CIF files to be output instead of each route being output once. The routes may also be output to a CSV file that has exactly the same format as the Routes sheet in a Visual-tm network file.
CIF Conversion Log File
When the CIF converter is run, a log file called CIFLogfile.txt is produced in the project’s System\Working directory. This lists the route number of each journey that is written out along with its direction code. The start time of the journey and the number of stops on it are also written out. Any link on which the maximum permitted speed is exceeded is also written to the log file. Likely causes for these are coding errors in the CIF file or missing coordinates for the stop. Times of 0000 in the file are also noted as these may be genuine but can also be due to omitted times in the CIF file.After the journeys, the total number of stops served by the journeys in the CIF file and the total number of links written to the output network are given, followed by the total number of stops made on all the journeys written out. This is the sum of the number of stops on each journey that has been written out. The total number of journeys written out is then given.
After this, there are two sections that are needed if the routes were output in EMME/2 format. The first of these is a list of the Operator Codes that were found in the CIF files along with the numeric value that was written to the output file for each code. The next section lists the CIF codes for the stops along with the stop numbers that were written to the output file.
Bus Stop Location Data in a Separate Spreadsheet
The stop codes that are used in the CIF file must be in a range in a spreadsheet that also includes their Eastings and Northings. Select the spreadsheet in the Coordinate File text box. Then select the range in the spreadsheet that holds the data and choose the Node Name (bus stop), Easting and Northing columns. Click the Convert button to convert the network.If you have multiple CIF files with the coordinates in Additional Location Information records at the start instead of in a spreadsheet, you only need to select the file listing the CIF files and enter the output file name. The Coordinate Details section should be ignored.
Adding zone connectors
The Public Transport network obtained from the CIF files has only the routes and their links and bus stops. The next step is to add the zone centroids and zone connectors to the network from a spreadsheet that lists the zone numbers along with the centroid coordinates. The other input file is the network file containing the routes and the Find Zone Connectors tab should be set up as below:Note that only nodes for which there is an entry in column G on the Nodes sheet will be used for assigning zone connectors. This eliminates problems caused by any unused nodes that the CIF to Visual-tm converter may have included. If the network file was not produced by this converter, then a value needs to be entered in this column for all the nodes, unless there are any that you do not wish to use for attaching zone connectors.
A value for the cut off radius should be entered. Every route that has a stop within the cut off distance is considered accessible and a zone connector will be created from the zone centroid to the stop on that route that is closest to the centroid. If there are no stops within the cut off distance, a single zone connector will be created to the stop that is closest to the zone centroid.
Note that the network must have node numbers that are all greater than the zone numbers, so this must be taken into account if the network file was produced by any means other than the CIF to Visual-tm converter.
The zone connectors are written directly into the Input Network File and the nodes i.e. the zone centroids are written to the start of the Nodes sheet.
Speed/Time and Walk Speed on the Zone Connectors sheet will be the value for Walk Speed on the CIF To Visual-TM converter tab. The remaining data sheets that are necessary for producing a Public Transport skim must be filled in. These are Mode Penalties, Vehicles, Fares and Path Penalties.
This can be used to create zone connectors for a highway network i.e. one that has no routes. To do this, tick the Highway Only tick box. This will create a zone connector to every node within the cut off distance or to the closest node if there are none within the cut off distance. There is no need for Column G on the nodes sheet to be marked with a value.
Trouble Shooting
When loading your network or running an assignment you may get an error in the error report or a message telling you that you cannot run your assignment. The message may point you to the error report where you may encounter errors such as those listed below:
“Mode No. 3 on route no. 0 is not valid. It does not appear on the Mode Penalties sheet.”
“Null Mode Number found in Route file for Route No. 1001”
“Invalid link from 38990 to 38991 in Route No. 1001”
“The no. of nodes on Route No. 1001 does not match the number specified on the header line.”
“Mode No. 3 is on a route but is not on the Fares table.”
“5 - This Link's B Node is not in the Node List 2 2903 at position 4 , 8 , 0 ,”
Sometimes these messages arise due to coding errors and the network file will need to be checked for these. However these messages can also be due to excel failing to read in the network data properly due to a mixture of text and number formatted cells. There is only one method which is guaranteed to correct this problem and that is to export the sheets as comma separated variable (CSV) files and then re-import them into the network file as text. The stages for this method are shown below:
- Open your network file in excel
- Select the sheet(s) which are causing the errors (Usually these problems occur in the Routes, Nodes, Links, Zone Connectors, Mode Penalties, Fares, Functions and CarParks sheets).
- Save the sheet(s) as individual CSV files (Click ‘file’, then ‘save as’ and give the sheet a name (i.e. “Nodes.csv”) and select “CSV (Comma delimited) (*.csv)” in the “save as type” drop down box).
- Delete the sheet you are on (i.e. Nodes)
- Insert a new worksheet into the bottom of the spreadsheet and rename this sheet to the name of the sheet which you deleted (i.e. Nodes)
- Select the box “A1” and click on ‘data’, ‘import external data’ and ‘import data’.
- Browse to the CSV file you have saved previously and select it.
- An import wizard will then appear, on the first sheet select the delimited option.
- On the next stage of the wizard select comma as your delimiter and click ‘next’.
- In the third stage of the wizard you must select each column in turn and when it is highlighted change the column data format box to text each time.
- Then click finish and OK.
- You will need to re-define ranges for the Nodes, Links and Zone Connectors sheets called ‘Nodes’, ‘Links’ and ‘Zone_Connectors’ respectively. The Nodes range is all of column A-K, the Links range is all of columns A-Q and the Zone Connectors range is all of columns A-Q. In order to define each range highlight the columns and go to ‘insert’ ‘name’ then ‘define’ and enter the name of the range and add it before you click ‘OK’.
- Once you have finished importing the CSV files you then need to save the file as your network file as an excel spreadsheet.
- Re-load the network and see if the problem still exists.
If you have Visual-tm version 3 or a more recent edition you can simply open the network file in excel, enter the full path and full path with filename into the cells ‘A1’ and ‘A2’ respectively onto the sheet called Path and run the macro called ‘Macro’. This will overwrite your current network file with a fully text formatted file. It will also create several CSV files in the same directory which you do not need to keep and can delete once the macro has finished running. You can then re-load the network and any errors due to the format of the cells in excel will be gone.
Back to tutorials On to matrices